Real Assets are about to reign supreme.
“Real” assets are assets with an intrinsic physical value due to their substance.
This includes precious metals, commodities, natural resources, transportation infrastructure (roads, airports, railroads), land, and real estate.
Basically everything we do here at Ri.
Many investors include real assets (or should be) in a diversified portfolio due to a relatively low correlation with financial assets, such as stocks and bonds.
But the world has changed… Today it’s questionable if real estate can still be considered a “real asset” asset class.
Since quantitative easing began flooding the market with cheap and easy money from December of 2008, real estate has had a high correlation with the stock market. Cheap money turned houses from a place you keep your kids/stuff in to an “investment” for ordinary people…

Today average home prices have a 60% correlation to the stock market. 60% might not sound like a particularly high correlation rate, but when we put on our data science glasses (and look at the t-scores and p-values), this is a very significant. In simple terms, it means that during months when housing prices are down, there is a very high probability that the stock market will also be down and vice versa.
But more important than the correlation exact % is the fact that it’s been increasing.
Prior to 2008, the correlation between the stock market and housing prices was 28%; in other words – not correlated (housing prices and stock prices were not related – the stock market was not the economy).
Since 2008 housing has been “financialized” – the values of homes are no longer based on supply and demand (wages and housing supply). Housing has turned into a leveraged investment class based on the premise that the future value of a house will rise because someday another buyer will pay more for the house than you.
Inflation is at 8.6% and the average cap rate on real estate is about 5% in most major cities. The cap rate is the yearly return in cash flow (aka rent) that an investor expects to make on a property.
Real estate investors now have a negative real yield on their investments.
Why should you care?
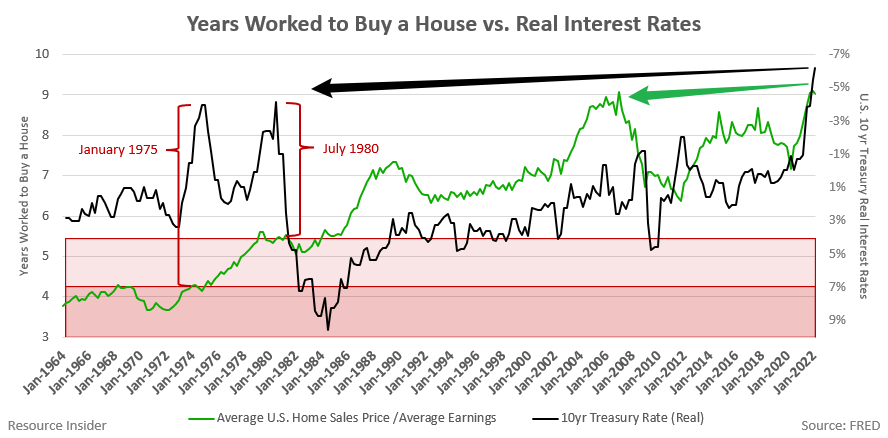
The last time real interest rates (in black) were at comparable levels was in January 1975 and July 1980. At that time, the cost of purchasing a family home, in terms of average annual salary (in green below), was 4.26 years and 5.43 years respectively. That means the average home cost about 5x the average salary.
Today, the average cost of buying a home in the USA is 9.09X the average salary. This is greater than the peak of the 2007 housing bubble.
There are two ways that this could play out:
- Wages surge higher while housing prices remain relatively flat.
- Housing prices collapse while wages maintain.
Either way, it indicates that the housing market is on track for a correction. And given the correlation we discussed earlier, it’s very possible the stock market is headed for a similar fate. It also means that housing is not a “real asset”.
What remains uncorrelated?
Real real assets.
Real assets tend to be uncorrelated because they are driven by supply and demand fundamentals rather than market sentiment (aka they’re based on reality).
This tends to mean more resilient cash flow underpinned by inherent value that protects wealth in times of volatility. It costs a certain amount of $$ to mine a pound of copper or pump a barrel of oil, thus they are unquestionably worth something… unlike, say, an app that acts as the “Uber of Water Fountains” (yes, this is real… sadly).
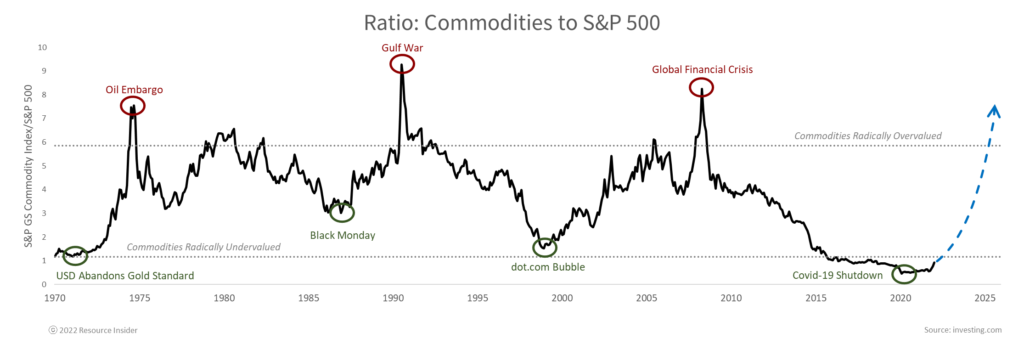
I believe we are on the cusp of seeing the below chart revert to the mean. Commodities and real assets are set to outperform other asset classes and thy’ve got a LOT of catching up to do.


Jamie Keech
CIO; Editor

Nick D'Onofrio
Head of Research

