Blog Post

Is the World Short Oil & Gas?

Is the World Short Oil & Gas

Energy markets are the talk of the town right now, and for good reason.

Here are some headlines:

  • Nord Stream 1 and 2 are down
  • US petroleum stocks are below the 5yr range
  • OPEC+ cuts production by 2million bbl/d

Nord Stream

The Nord Stream pipelines connect Russia to Germany via the Baltic Sea. Nord Stream 1 historically supplied the EU with ~35% of the total gas imported from Russia; Nord Stream 2 (which was on track to be operational in the first half of 2022) is equally as large.

Both Nord Stream 1 and 2 are down after suffering catastrophic losses of pressure. No one is exactly sure what happened to the pipelines, but the Swedish Security Service said that they found evidence of detonations and have high suspicions of “gross sabotage.”

No matter who attacked the pipelines, the results are clear: Europe is in for a very tough winter.

It’s estimated that it will take at least 20-25 weeks just to get all of the materials and equipment in place to repair the pipelines. Meaning that there is no way to repair the pipelines for at least 6 months… Probably much longer.

This leaves Europe very short on energy heat homes this winter. Protesters are claiming  they will be forced to choose between eating or heating their homes.

The damage to the pipelines means that Russia just lost substantial physical capacity to transport natural gas to Europe, even if current sanctions are removed. With the loss of the pipelines, also comes the loss of any leverage for Europe to bring Russia to a compromise over the Ukraine invasion… Which just made this war much more complicated. 

We should all be paying close attention to the pipelines connecting Russia to Europe via Ukraine. These pipelines just became essential to the EU. 

If Ukraine was looking for leverage to join the EU and/or Nato… They just got it.

US Petroleum Stocks

The US’s Energy Information Administration (EIA) releases a weekly inventory report – this week’s was quite telling. 

Two noteworthy items:

  • Gasoline demand increased
  • Total petroleum stocks fell below the 5-year low once again

In short, demand is strong and supply is struggling to keep up in a big way. Petroleum stocks haven’t been this low since 2004.

What made this particularly  important is that  a few hours later it was announced that…

OPEC+ Cuts Production

OPEC+ is a group of 23 oil-exporting countries that decide how much crude oil to sell on the global market.

At the core of this group are the 13 original members of OPEC (the Organization of Oil Exporting Countries), which consist of mostly Middle Eastern and African countries. OPEC was formed in 1960 as a cartel, with the aim of fixing the worldwide supply of oil and its price.

Today, OPEC+ nations produce around 40% of the world’s crude oil; the two biggest producers being Saudi Arabia and Russia.

Just a few weeks ago it was reported that Russian President Vladimir Putin met with Saudi Crown Prince Mohammed bin Salman (MBS) suggesting that OPEC+ cut production.

Those suggestions became a reality as OPEC+ agreed to cut production by 2 million barrels per day. 

Given the fact that OPEC+ has struggled to meet their production quotas, this cut will more likely look like a cut of ~900,000 barrels per day to the current supply.

Most of that production cut will come from nations that have a complicated history with the west: Saudi Arabia (48%), UAE (16%), Kuwait (15%), and Iraq (11%).

What drove the production cuts?

The United Arab Emirates’ (UAE) energy minister, Suhail Al Mazrouei, said that the group was solely focused on avoiding an oil price crash similar to 2008. 

Mazrouei said “In Europe they have their story, in Russia they have their own story. We can’t  be siding with this country or that country.” 

With a recession looming OPEC+ is most concerned about keeping a finger on the pulse of global oil supply and demand to maintain profitable prices.

The takeaway?

Oil and gas prices will likely head lower in the short term if the world heads into a recession, but they won’t be staying low for long. OPEC+ is determined to keep prices high even in the midst of a recessionary environment.

Remember, recessions massively impact oil and gas markets. Inventories rise when, and only when, the business cycle slows; this in turn leads to lower production capacity.

The world is short on energy supply and any reduction in production capacity will have a longstanding impact on the market. This will only be righted through significant investment in new production.

Unfortunately, the US is working hard to beat the EU in the global “idiodic energy policy competition”. 

Here’s a short summary of some of the current administration’s noteworthy policy decisions:

  • Kill Keystone XL pipeline on Day 1
  • Drain the Strategic Petroleum Reserves (SPR) before midterm elections
  • Tell oil and gas producers to lower prices at the pump…. Seriously WTF?!?!
  • Beg Saudi Arabia and Russia to produce more oil
  • Contemplate banning exports on refined products and gas
  • Lift Venezuelan sanctions to import more oil

If you’re not long oil, you might want to reconsider… 

Picture of Jamie Keech

Jamie Keech

CIO; Editor

Picture of Nick D'Onofrio

Nick D'Onofrio

Head of Research

Facebook
Twitter
LinkedIn

Silent Warnings in Real Estate

Silent Warnings in Real Estate

We’re in the midst of stagflation with a recession looming and the Fed has been unrelenting in raising interest rates. 

Big Problems are Ahead for Real Estate Investors.

If you locked in a 30-year fixed mortgage rate on a $600,000 house at 2.6% interest rate in 2021 you have the same monthly mortgage payment as someone that just bought a $380,000 home at today’s 6.5% mortgage rate.

That’s ~37% reduction in home value based on monthly mortgage payment affordability, but that’s not the only problem lurking in the real estate market…

Bonds are back baby! 

US Treasury rates are now trading at 3.97% (6-month), 4.27% (2-year), and 3.83% (10-year).

US Treasury’s now generate nearly that same yield as buying and renting out a house in America (aka the cap rate).

Would you rather tie up capital in a home, take on the costs of ownership and deal with some asshole tenant you’re renting it out to… OR simply buy US Treasuries for the same return?

Exactly.  

This is going to translate to a massive real estate selloff, especially among the big wall street firms (like Blackstone) who have been buying up single family homes hand over fist. 

In markets like Dallas, Austin, Denver, Salt Lake City, Seattle, and Los Angeles US Treasury rates are already higher than average cap rates. 

Meaning there is very little incentive for investors to be invested in these markets. Especially if prices are going down.

Before 2010 institutional landlords essentially didn’t exist in the single-family-rental market. Now there are more than 30 multi-billion dollar institutional investment funds, such as Blackstone, focused on buying single family housing.

Next will be margin calls as banks order investors to sell off properties to deleverage their portfolio. 

Many wall street real estate investors have funded their strategy using floating rate credit facilities. So every time the Fed hikes rates, their cost of capital on their EXISTING portfolio gets more expensive.

Think of the crisis in adjustable rate mortgages from 2008, but this time instead of individual borrowers getting hit with higher rates and defaulting, it’s now big landlords who own thousands of units. Sometimes all in one city or neighborhood.

The “experiment” of Wall Street buying single-family homes was never meant to last. Wall Street piled in, earned their fees, and are now looking to exit as quickly (and quietly) as possible before the crash gets bad.

Thinking about buying a new home? Maybe give it a few minutes… 

Real Assets.

As the financialized world sits precariously on the edge of ruin, we must remember where there is value: commodities.

If you are a Ri Member, you understand the commodity trade, but sometimes it’s hard to remember why we are commodity investors when our portfolio is getting whacked.

This is a volatile game that isn’t for everybody, but for those willing to weather the storm and play the game to the final whistle, there can (and should!)  be big rewards. 

Right now the world is in a transitional period – realizing that the past 10-years of making big returns by investing in high growth overpriced tech names has come to an end. 

We’re now in a world in turmoil, short on commodity supply, and on the edge of a recession. As hard as it is to stomach, this is what a financial regime change looks like – hard times and volatile markets. 

We must not forget that on the other side of this trade there will eventually be institutional capital flows into commodities that will drive commodity valuations (multiples) higher.

This move will happen faster than anyone anticipates, leaving investors little time to reposition their portfolios, which is why it is essential to allocate capital while there is blood in the streets and deals are cheap.

Picture of Jamie Keech

Jamie Keech

CIO; Editor

Picture of Nick D'Onofrio

Nick D'Onofrio

Head of Research

Facebook
Twitter
LinkedIn

Friendly Fire

Friendly Fire

Have you ever wondered why we no longer invade middle eastern countries?

I’ll give you a hint. It has nothing to do with Trump, Obama, or Biden spontaneously growing a conscience. 

It has nothing to do with a love for the troops. 

There  is one simple reason: ENERGY SECURITY

We don’t invade middle eastern countries because we don’t have to. The US shale revolution accomplished what pouring trillions of dollars and thousands of life into desert countries never could. It turned the USA into a net exporter of energy from a net importer. 

The ability to economically recover shale gas is perhaps one of greatest technological achievements of this generation and, although few know it, initiated the biggest shift in geopolitics of the last 30-years. Allowing US isolationism to thrive and giving Presidents the ability to turn the other cheek when their line in the sand is crossed. 

Because here is the reality: If your country does not have energy security it’s not really your country… You’re merely renting it from someone else. 

Just ask our friends in the EU…

Despite ample warnings from Trump and others they’ve managed to snatch defeat from the jaws of victory and leave an entire continent exposed to the imperial ambitions of a lunatic despot. 

But Jamie, that’s not fair you say? Europe can’t contend with North America’s vast geological resources. Just the luck of the draw!

Wrong!

Even though they don’t want you to know it, there is vast shale potential in Europe too. According to a 2011 study, Europe has 18 trillion cubic meters (tcm) of natural gas.

Europe has a long history of oil and gas production dating back to the mid 19th century, just like the US. The Polish Bobrka field was discovered in 1853, gas in Britain’s Weald Basin was discovered in 1875, and deep gas was discovered in Italy’s Po Valley in 1945. 

There is oil and gas in Europe.

But to put this fact into context first we must explore how shale revolutionized O&G estimates for US recoverable reserves. 

In the image below you’ll notice two things:

  1. Shale extraction exploded the US’s recoverable natural gas reserves
  2. When exploration starts reserves consistently increase (i.e. there is no short term lack of supply, only investment)

This next chart demonstrates more of the same. Basically if you invest in exploration and production (E&P) you tend to  find new reserves (shocker!).

Now, let’s look at a few European countries with shale potential – which have all been thwarted by bad policy. 

Below is a map showing several of the shale gas basins in Europe. It should also be noted that historically when large scale exploration programs have been launched they have found more hydrocarbons than expected.

European Shale Basins

Some of the most prospective shale gas fields are:

Poland: Estimated reserves of 5.3 tcm of shale gas with +1bcf/d of production possible by 2025 (~3% of the EU’s current gas demand) if development started today. 

But, because of a lack of support from the EU and local governments there has not been any natural gas production to date

UK: There are shale plays in the East and South along with remaining conventional reserves in the North Sea. There are estimates of more than 25 tcf of recoverable natural gas in Britain.

No commercial gas has been produced to date – British regulations stopped shale gas exploration in its tracks via a 2019 moratorium. Today, the tide is turning. Just a few days ago, new British Prime Minister Liz Truss removed the ban on fracking.

France: The infamous Paris Basin (discovered in 1923) has produced significant oil – 800 wells have been drilled producing more than 240 million barrels of oil. The Paris Basin is estimated to have more than 5.6 tcf of natural gas resource and 558 million barrels of oil. 

In 2017, led by French President Macron, parliament passed laws to become the first country in the world banning any new oil exploration licenses with immediate effect and all oil and gas extraction by 2040. 

Even in the midst of an energy crisis, the French are sticking by their green policies. 

The takeaway: the EU has hydrocarbon resources.

Energy independence?

There is a case to be made that within 3 years the EU could be approaching energy independence if they simply opened up the market to meaningful exploration; not just shale but offshore as well. 

In the US, we saw ~30% natural gas production growth in 2 years from 2017 to 2019. 

With the EU’s current high gas prices, the tailwind behind E&P growth could be much greater than what we saw in the US. 

We haven’t even talked about the Dutch Groningen gas field yet – one of the 10 largest gas fields globally. Just 5 years ago the field was producing 30bcm annually. Since then, the Dutch government has reduced production to sub 5bcm annually, but believes production could easily be ramped up to 25-30bcm (16% of Russian imports). 

Why did they reduce production? Because regulators believe that natural gas production out of certain regions of the Groningen gas field carry significant earthquake risk. 

Europe’s reliance on Russian gas is not geological destiny, but rather choice. A choice that continues to look increasingly dire as we approach winter. 

What do you think politicians’ appetite for O&G production will be after a winter of sleeping in their mittens?

Picture of Jamie Keech

Jamie Keech

CIO; Editor

Picture of Nick D'Onofrio

Nick D'Onofrio

Head of Research

Facebook
Twitter
LinkedIn

Which do you want to be?

Democrats passed the Inflation Reduction Act and it magically made inflation vanish, even before the bill was signed into law. This is how good the bill is, it retroactively reduced inflation.

No, this is not Biden having a brain fart. This is the official messaging of the current administration. 

Now, this isn’t exactly a lie – the official inflation number increased 0% from June to July (month over month), but it did increased by 8.5% year over year.

The Market Responds

Inflation fell from 9.1% in June to 8.5% in July, and the market believes that the Fed is getting closer to hitting a homerun (AKA gradually cooling inflation without a recession). This bodes well for stocks and the USD, and the market is reacting accordingly. 

As we mentioned a few weeks ago, the US looks like a much more attractive home for capital at the moment than the rest of the world. For this reason, we’ve been predicting this rally in equity markets… But I wouldn’t get your hopes up as we don’t expect it to be long lived.

Industrial output peaked in 2Q 2022. What many investors got wrong was the assumption that following this peak would be an immediate recession. Before we see a recession, manufacturing jobs have to start contracting. In July, manufacturing jobs increased by 30,000. 

The 30,000 jobs created are half of what that number was in April, which establishes a slowdown, but not a contraction. 

Manufacturing jobs are a lagging indicator, but tend to be led by the ISM Manufacturing Employment Index by about 3 months. This is also yet to decline in a manner that would indicate we are in a recession.

ISM Manufacturing Employment Index

So, over the past 2 weeks the market has apparently decided that we’re not in a recession, the economy is strong, and inflation is declining… 

All this misses a few key points.

If inflation stays at 0% month over month for the remainder of the year, December’s inflation number will still land at 6.3% year over year. Which is still 3x higher than the Fed’s target of 2%. 

Meaning, the Fed isn’t going to pivot – they’ll likely be hiking rates into 2023.

Here are the major events leading up the September Fed meeting and the importance of each event:

  • Fed’s Jackson Hole Economic Symposium: end August (updated Fed guidance)
  • Monthly Jobs Report: Sept. 2 (indicator of economic growth)
  • September Inflation: Sept. 13 (will determine magnitude of rate hikes)
  • Fed Interest Rate Decision: Sept. 21 

The road to this imagined September pivot on rate hikes will be paved with pain as investors come to realize that the economy is neither in a growth or recessionary phase. We are in the midst of STAGFLATION – stagnant economic growth paired with high inflation.

Let me be as clear as possible. 

Inflation will not resolve itself, the Fed will have to slow the economy to contain inflation. The market will likely come to this realization when 2023 corporate earnings expectations are slashed.

Meaning, eventually the economy will roll over into a recession and only then will the Fed pivot on interest rate policy.

Tech jobs are getting slashed left and right. Many of my tech friends are telling me their companies are in the midst of laying off 30% of their workforce.

Housing is beginning to cool off as well – new homes for sale are handily outpacing new homes sold. In the last 50 years, this has always led to a recession, and usually an ugly one, as housing stats and GDP tend to be very closely correlated.

New Homes for Sale (Orange) vs. New Homes Sold (White)

The size of the gap between Housing Sales and Houses For Sale suggests a recession like 1974, which was pretty damn ugly. 

Which are you going to be?

The world has yet to come to terms with the fact that we are not going back to an environment supported by low inflation, globalization, and cheap energy. 

Out of control government spending continues to tip the debt/GDP scale in the wrong direction, which is wildly bullish for precious metals.

Meanwhile, destructive environmental and energy policies continue to drive capital out of the commodity sector and reduce supply. This has been the first commodity upcycle to end without any significant capex being spent.

Think about that, prices of commodities went up, and almost no money was spent increasing supply… thus offering no price relief.

Once we get through this bumpy patch, what is it going to take to actually bring more supply online? Commodities such as copper, oil, gas, uranium, lithium, etc will NEED to be much much more expensive. 

Picture of Jamie Keech

Jamie Keech

CIO; Editor

Picture of Nick D'Onofrio

Nick D'Onofrio

Head of Research

Facebook
Twitter
LinkedIn

Rates & the Market

Rates & the Market

Recently we discussed how, as the Fed raises rates, we expect the dollar to continue its move higher, and a subsequent rally in broader equity markets. 

We are currently seeing this trade in full swing as the Fed raised the fed funds rate last week by 0.75% to 2.25% and the S&P 500 is trading at about 4,125 (up from 3,700 a few weeks ago!). Stocks are still following the playbook from the past decade, acting as though the Fed will soon ease interest rate policy. 

This rally will be short lived. 

Things are different in a post pandemic world – inflation, not deflation, is now public enemy number 1. Under the current economic conditions, the Fed will likely continue hiking rates into the fall  until inflation is under control. 

The only way inflation is going to slow is through a true recession, the kind where we see mass layoffs and real economic hardship. Only then will the Fed finally start slowing hikes or cutting rates.

This recession is coming faster than most believe.

It’s going to be painful BUT it will kick off the next bull market in precious metals. In the meantime, it is important to understand why markets are behaving the way they are.

The chart above compares the S&P 500 today (black) with the S&P 500 during the 2000 tech bubble (blue) and the 2008 housing bubble (green).

As you can see… It’s not looking good for our generalist friends.

Gas & Fertilizers

The green revolution tribe is quickly turning into a death cult. The hardcore greenies are pushing forward policies that are going to have very scary impacts on access to food and energy.

Prime Minister Justin Trudeau is pursuing the same climate policy that sparked mass protests in Europe.

The Trudeau government introduced a plan to reduce nitrogen emissions from fertilizer use similar to the Netherlands policy that sparked protests among thousands of farmers.

The plan to achieve emission targets set by the Canadian Federal government calls for reduction in fertilizer production by 30%.

Now… I’m no farmer, but I have been blessed by a bit of common sense, and it’s telling me:

Less fertilizer = Less food

Let’s take a look at our friends in Sri Lanka who decided to ban organic fertilizers which cut crop yields in half.

Turns out hungry citizens don’t make the best constituents… Conversely they do appear to have more energy to occupy Presidential Palaces.

While we’re on the topic of fertilizers…

Last Wednesday, Germany’s BASF (the world’s largest chemical company) cut ammonia production even further to preserve natural gas for electricity use. Germany’s first and fourth largest ammonia producers, SKW Piesteritz and Ineos also said they could not rule out production cuts as the country grapples with disruption to Russian gas supplies.

It’s looking like a long, cold and now hungry winter for Europe. 

Famines & Fertilizers.

Farmers rely on three key nutrients for fertilizer: nitrogen, phosphorus, and potassium. A combination of these elements is used to fertilize crops and maximize harvests. Natural gas, after being converted to ammonia, is the main feedstock for nitrogen based fertilizer.

Most of the world’s ammonia is used for making nitrogen fertilizers. 

Fertilizer shortages not only mean that prices have been rising, but many farmers are not even able to buy as much fertilizer as they need. This has led to farmers all over the world struggling to figure out how to keep crop yields up with as little fertilizer as possible.

This might sound like a distant problem, but less fertilizer is going to lead to food shortages. The world’s biggest soybean producer estimates that a 20% cut in potash (potassium) would result in a 14% drop in yields. The International Fertilizer Development Center is predicting that this year’s rice and corn harvest in West Africa will shrink by 30%.

Food shortages make food more expensive. Even in the best-case scenario, experts are calling for lower crop yields and higher grocery store prices across the board on everything from milk to beef to packaged foods. This could last for months or even years.

Food inflation causes people to eat more processed/unhealthy food and poor diet leads to a litany of health consequences.

Energy supply is life.

The takeaways.

There are a few important points to note:

  • We have not fully experienced the effects of the Russian invasion – markets are trying to price in expectations, but we haven’t seen supply/demand shortfalls fully play out yet.
  • The energy and fertilizer shortage is going to sustain inflationary pressures. 
  • The same inflationary pressures are likely to stir more and more civil unrest around the world. 

This wild ride is just getting started. Stay vigilant and diligent, there will be opportunities to make a few fortunes over the coming years for those paying attention.

Picture of Jamie Keech

Jamie Keech

CIO; Editor

Picture of Nick D'Onofrio

Nick D'Onofrio

Head of Research

Facebook
Twitter
LinkedIn

The USD

Last week we saw another MASSIVE inflation print as headline CPI reached a four-decade high: 9.1%

This puts the Fed and markets in an interesting position. As inflation has yet to peak there remains pressure to raise rates even faster to slow the economy, meanwhile GDP is likely contracting for the second straight quarter. This means the Fed is in the unusual position of trying to slow the economy while GDP is contracting. 

This comes as no surprise to Ri Members, as we’ve been hammering on this theme for months. We also know these conditions are setting up a trade in precious metals. 

However, precious metals miners have been under significant selling pressure all year. This downward pressure is unlikely to let up before the fall, when I expect silver and gold to enter their next bull run. 

Let’s dig into why. 

The USD &  Rates

Fact: precious metals perform well when the dollar is weakened. 

Today this is largely tied to the fed funds rate. As the fed funds rate increases, overall interest rates such as treasury and credit rates rise. Higher rates typically result in a stronger economy and better returns. As global capital flows into US dollar-denominated assets, chasing higher returns, the dollar strengthens.

The important takeaway here is that the dollar won’t weaken until the Fed is forced to capitulate on their current stance by cutting interest rates. 

The question is when will that happen?

The Fed will only capitulate when a recession is imminent.

Globally many central banks have been far slower than the Fed to raise rates, especially the European Central Bank (ECB) and Bank of Japan (BoJ). Because of this, we are seeing capital flee those regions and pour into US equities and bonds. 

This has resulted in the USD surging higher. We’re seeing the Euro and USD hit parity for the first time.

This is good for US consumers, but bad news for exporters – AKA bad for GDP growth.

High inflation is catalyzing a narrative that the Fed is doing the right thing by raising rates to preserve US equity markets and dampen wage growth. This narrative could very likely only last a few months while the Fed maintains hope that a US recession isn’t a done deal…

BUT, the rest of the world appears to be sticking to loose monetary policy, and keeping interest rates low. The ECB and BoJ’s decision to promote loose monetary policy is furthering dollar strength, whilst their own economies struggle due to high oil/coal/natgas prices impacting growth. 

REMEMBER: Energy commodities are priced in USD, meaning price increases are even greater in weak foreign countries. 

For example:

  • Last summer EUR€1.00 was worth USD$0.85. 
  • Today EUR€1.00 is worth USD$1.00. 
  • Last summer  Brent Oil was trading at USD$70/bbl, or EUR€59.50/bbl. 
  • This summer Brent Oil is trading at USD$100/bbl, which is EUR€100/bbl. 

While that’s a 43% increase in USD terms, it’s a 68% increase in EUR terms.

What does this mean for markets?

Since mid June we have seen US equity markets trading higher. Perhaps this summer we’ll continue to see a rally in US equities while USD strength persists and foreign assets plunge.

Eventually (we think this fall) stocks will finally get the message that 2023 earnings are going to SUCK. Then it’s risk off in the US this autumn and the party is over.

When the Fed realizes that the earnings outlook is bleak and a recession is imminent, only then will they start softening policy (AKA slowing hikes or cutting rates). 

What will happen next (our thesis) ?

  • The dollar will start to fall;
  • US equity markets will sell off hard;
  • Precious metals will catch a bid in a big way; and 
  • Energy Prices are going to soar with a weakening USD as a tailwind.


This has been a brutal few months for basically every other asset class out there. I know from talking to several Ri Members over the past month that most of you are feeling it across your portfolio. 

But, buckle up friends. This ride is only getting started.

We all knew a major secular sell off was coming. We all knew tech had to get crushed. We knew the S&P was massively overvalued compared to real assets. We knew interest rates could not stay at all time lows FOREVER and had to rise. 

We’ve been talking about it and positioning for months years. 

Now the rebalancing is happening. 

There’s a crisis, blood in the streets, and panic. 

And investors are doing what they always do in a panic – going to cash. Selling anything they can at any price. Stuffing the USD under the proverbial mattress. 

And when the dust settles…

When companies start getting valued on cash flow as opposed to hype… 

When earnings get crushed… 

When the dollar begins to slide…

And, the reality of this brave new world sets in…

Where do you think that money goes??

  1. Gold;
  2. Energy; and
  3. Basically every other essential commodity. 

 So… when you lie awake at night and think about your  beaten down portfolio, fear not, you’re in the right place.

And when your friends at the country club tell you they’re buying the dip and loading up on Facebook… Maybe forward them this post and help them do a little damage control before it’s too late!

Picture of Jamie Keech

Jamie Keech

CIO; Editor

Picture of Nick D'Onofrio

Nick D'Onofrio

Head of Research

Facebook
Twitter
LinkedIn

Fragile – handle with care

Fragile – Handle with Care

At Resource Insider we have been talking about how gold is an antifragile investment (as volatility and uncertainty increase gold strengthens), and why the current situation in the global economy has been setting up for gold to outperform broader equity markets.

Today, the economy appears increasingly more fragile as the hours pass. Let’s discuss some of the pain points that are starting to show.

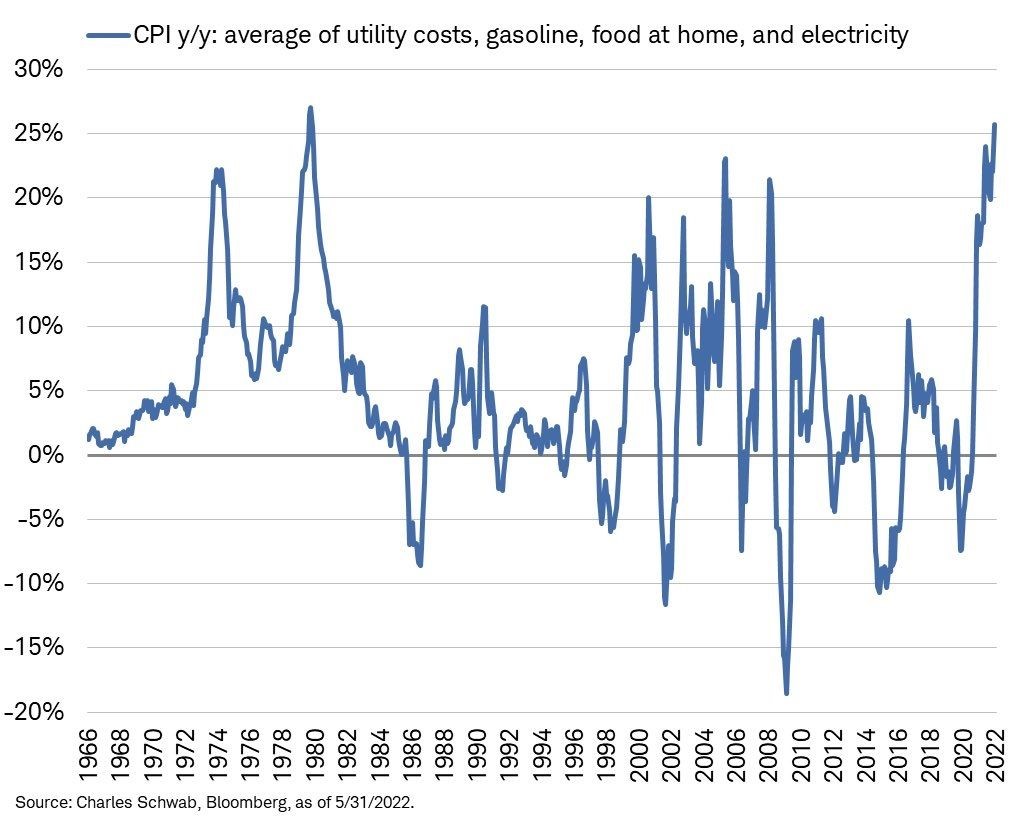
Inflation has been eating into consumer buying power as the average person’s fixed costs are skyrocketing. In  May, the average cost of utilities, gasoline, food at home, and electricity printed the highest inflation number since the 1980 peak of 25.7%.

You’ll recall last year economists and politicos called inflation “transitory” declaring that consumers are “flush with cash”.

Both statements are proving to be false.

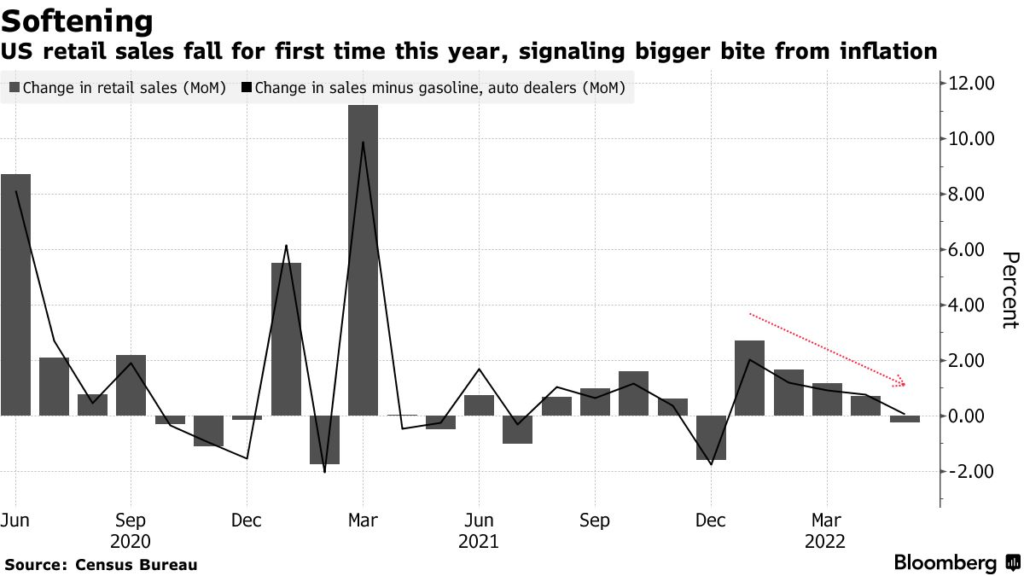
In May, US retail sales posted the first drop in five months, led by a plunge in auto sales and other big-ticket items.

Retailers such as Walmart, Gap, and others are starting to feel the pain as well. According to Bloomberg, companies that released earnings over the past 2 weeks within the S&P consumer indexes with a market cap of at least $1 billion reported that inventories rose $44.8 billion (AKA they have a bunch of stuff they can’t sell). That’s a 26% increase from this time last year.

In the past, the primary culprit behind inflation was wages. Labor is a huge component of input costs, so the Fed’s playbook to fight inflation has been to raise interest rates and increase unemployment. In the wake of globalization, the US has sustained much lower levels of unemployment without experiencing inflation. 

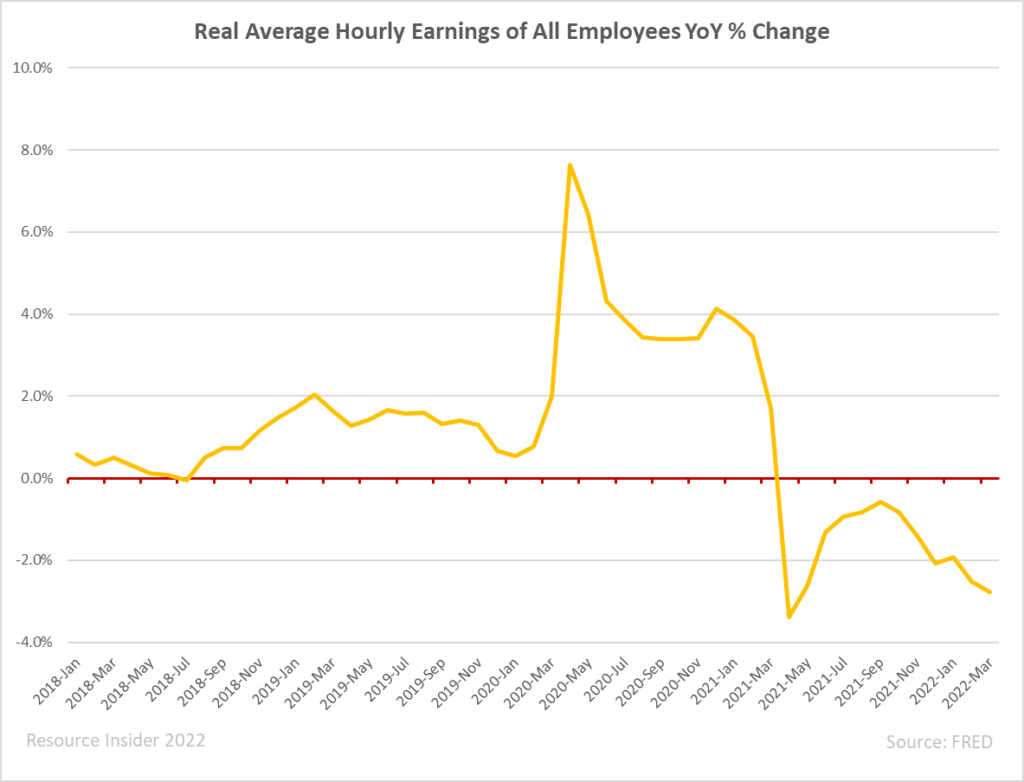
Today’s inflationary environment is different. This wave of inflation has been driven by supply constraints, resulting in real wages going down (consumers have less purchasing power).

The Fed is fighting it by raising interest rates. In return, this is further putting a squeeze on corporate profits as the economy weakens. We are starting to see the first wave of layoffs as companies such as Netflix, Peloton, MasterClass, Coinbase, Robinhood, and Carvana have all laid off as much as 20% of their workforce. Even Tesla has announced layoffs to “keep from going bankrupt.”

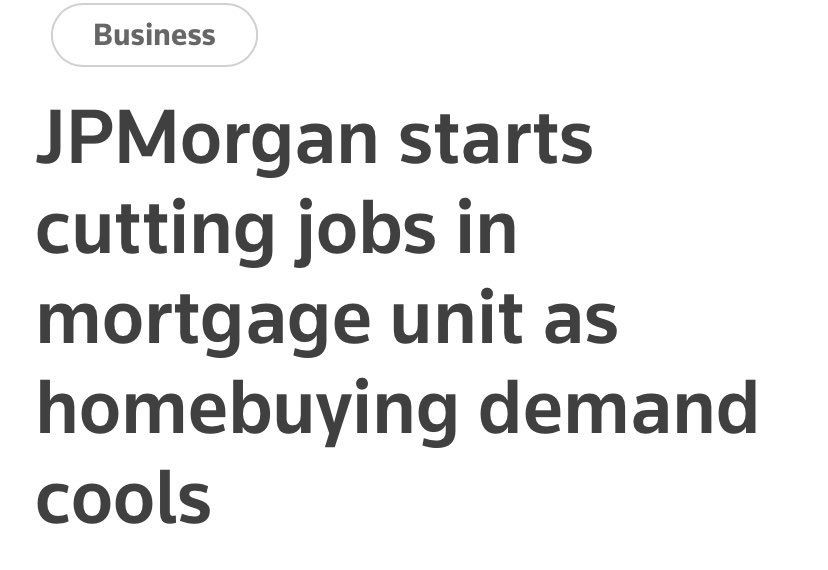
Now, the cracks are starting to show in real estate.

Twin Deficits

The US is in a twin deficit, meaning there is both a current account deficit and a fiscal deficit. 

  • A fiscal deficit is when government spending is more than (tax) revenue. 
  • A current account deficit is when the value of the goods and services imported is more than the value of the products exported. 

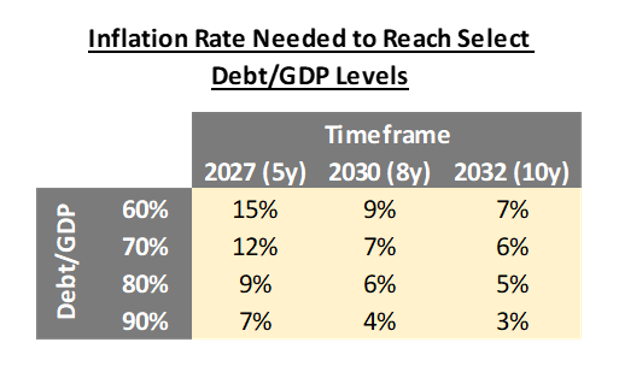
 The way that a country typically reduces a fiscal deficit is by running at surplus (aka exporting more than it is importing). The US is far from running at a surplus and the fiscal deficit is in bad shape with debt levels running at 125% of GDP.

So, the only real solution to solving the debt problem is by inflating the debt away.

Meaning, making money so worthless that the debt becomes worthless as well.

Let that sink in for a minute…

When you think about from this perspective, you start to understand the high degree of inflation that could become the new norm.

The table above shows the inflation rate needed to reach healthy debt to GDP levels assuming  spending stays constant and real GDP growth is 0%.

Death to Bonds

If I were to write a guide on how to crash the US Treasury market, it would be a simple four part process. 

  1. Stop the Fed’s QE program, which was financing the US deficits
  2. Raise Interest Rates, making investing expensive which slows growth
  3. Impede trade of the world’s biggest commodity exporter (Russia) 
  4. Impede trade of the world’s factory (China)

Sound familiar?

That’s because ALL of these things are currently taking place.

Steps 1 and 2 are slowing economic growth and steps 3 and 4 are creating systemic inflation that the Fed can do very little to stop. All while real incomes are being cut as rising interest rates slash consumer spending.

The result? 

Death to bonds. 

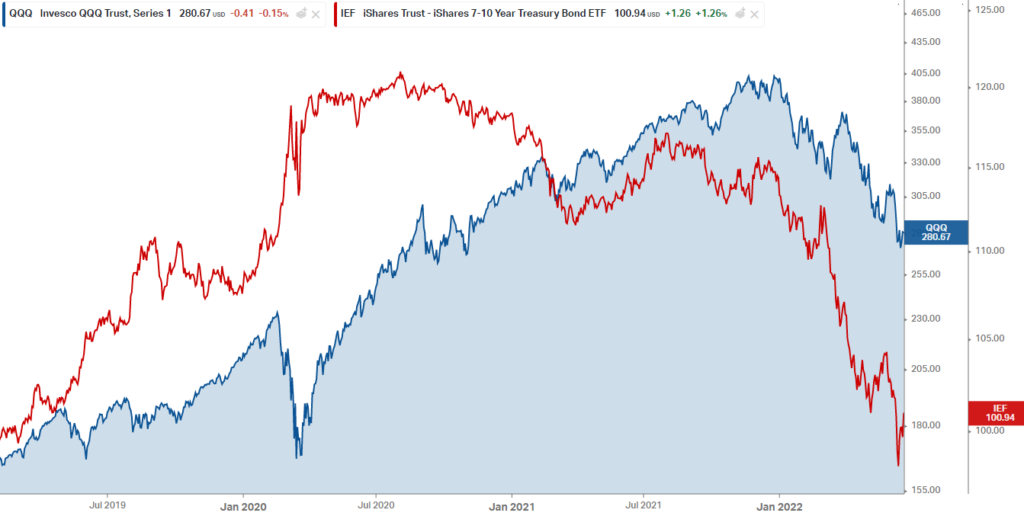
Since the pandemic started, US Treasuries have been highly correlated to equity markets, which you can see in the chart below. The NASDAQ is in blue and US Treasuries in red.

If the bond market is dead, where will people find solace?

I think that answer HAS to be GOLD. (especially considering the recent implosion of bitcoin)

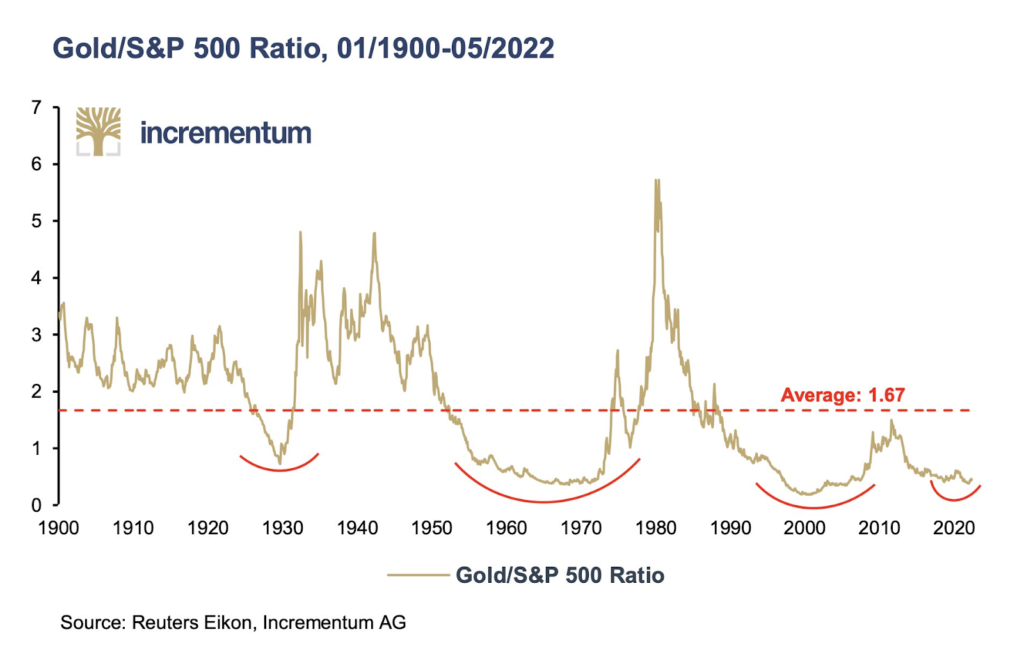
According to Incrementum, gold could more than triple against the S&P 500 if it reaches its 122-year median of 1.67 over the next ten years as the ratio is at 0.47 today.

One last thought to keep in mind. 

Gold will likely not take off until the general investor loses faith in bonds, stocks, and the general economy. This is a long process, and we are still likely +8 months away from that becoming a reality, but when the move happens it will be fast and violent. 

Prepare accordingly my friends.

Picture of Jamie Keech

Jamie Keech

CIO; Editor

Picture of Nick D'Onofrio

Nick D'Onofrio

Head of Research

Facebook
Twitter
LinkedIn

Real Assets are about to reign supreme.

Real Assets are about to reign supreme.

“Real” assets are assets with an intrinsic physical value due to their substance. 

This includes precious metals, commodities, natural resources, transportation infrastructure (roads, airports, railroads), land, and real estate.

Basically everything we do here at Ri.

Many investors include real assets (or should be) in a diversified portfolio due to a relatively low correlation with financial assets, such as stocks and bonds.

But the world has changed… Today it’s questionable if real estate can still be considered a “real asset” asset class.

Since quantitative easing began flooding the market with cheap and easy money from December of 2008, real estate has had a high correlation with the stock market. Cheap money turned houses from a place you keep your kids/stuff in to an “investment” for ordinary people…

Today average home prices have a 60% correlation to the stock market. 60% might not sound like a particularly high correlation rate, but when we put on our data science glasses (and look at the t-scores and p-values), this is a very significant. In simple terms, it means that during months when housing prices are down, there is a very high probability that the stock market will also be down and vice versa.

But more important than the correlation exact % is the fact that it’s been increasing. 

Prior to 2008, the correlation between the stock market and housing prices was 28%; in other words – not correlated (housing prices and stock prices were not related – the stock market was not the economy).  

Since 2008 housing has been “financialized” – the values of homes are no longer based on supply and demand (wages and housing supply). Housing has turned into a leveraged investment class based on the premise that the future value of a house will rise because someday another buyer will pay more for the house than you.

Inflation is at 8.6% and the average cap rate on real estate is about 5% in most major cities. The cap rate is the yearly return in cash flow (aka rent) that an investor expects to make on a property.

Real estate investors now have a negative real yield on their investments.

Why should you care?

The last time real interest rates (in black) were at comparable levels was in January 1975 and July 1980. At that time, the cost of purchasing a family home, in terms of average annual salary (in green below), was 4.26 years and 5.43 years respectively. That means the average home cost about 5x the average salary. 

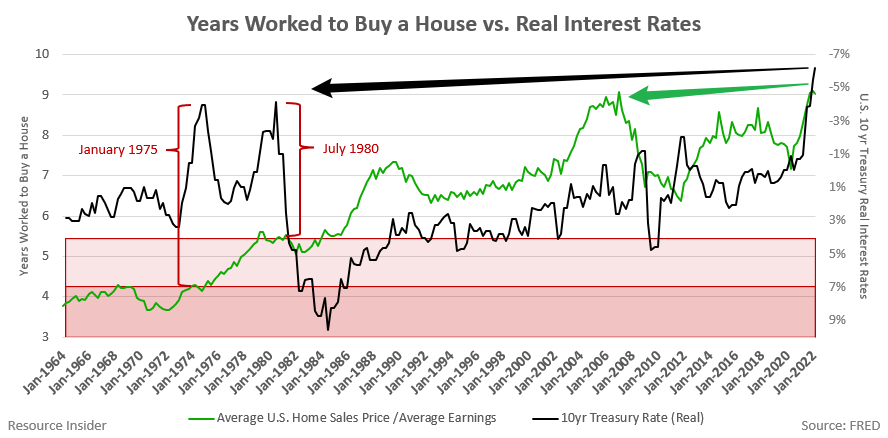
Today, the average cost of buying a home in the USA is 9.09X the average salary. This is greater than the peak of the 2007 housing bubble.

There are two ways that this could play out:

  1. Wages surge higher while housing prices remain relatively flat.
  2. Housing prices collapse while wages maintain.

Either way, it indicates that the housing market is on track for a correction. And given the correlation we discussed earlier, it’s very possible the stock market is headed for a similar fate. It also means that housing is not a “real asset”. 

What remains uncorrelated? 

Real real assets. 

Real assets tend to be uncorrelated because they are driven by supply and demand fundamentals rather than market sentiment (aka they’re based on reality).

This tends to mean more resilient cash flow underpinned by inherent value that protects wealth in times of volatility. It costs a certain amount of $$ to mine a pound of copper or pump a barrel of oil, thus they are unquestionably worth something… unlike, say, an app that acts as the “Uber of Water Fountains” (yes, this is real… sadly).  

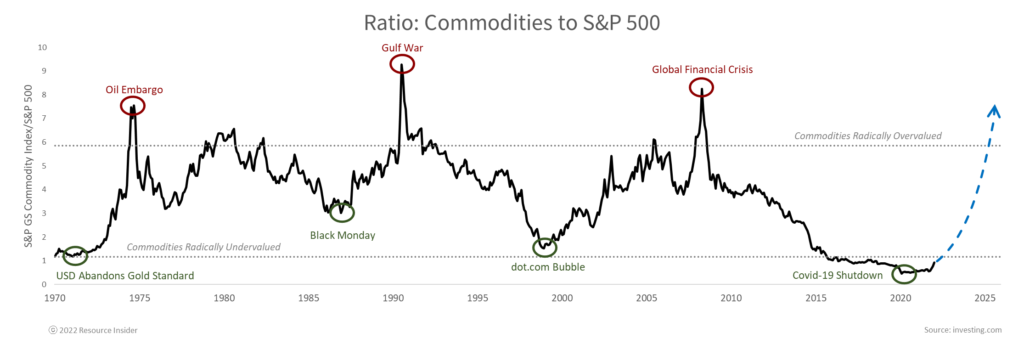
I believe we are on the cusp of seeing the below chart revert to the mean. Commodities and real assets are set to outperform other asset classes and thy’ve got a LOT of catching up to do. 

Picture of Jamie Keech

Jamie Keech

CIO; Editor

Picture of Nick D'Onofrio

Nick D'Onofrio

Head of Research

Facebook
Twitter
LinkedIn

A closer look.

A closer look at the markets.

I am not saying that a recession is imminent, but one may be lurking around the corner; and if it’s not a recession, it’s probably recession’s cousin stagflation.

Let’s take a quick look at what we’re seeing. 

Real WagesWages adjusted for inflation have been growing at a negative rate since April 2021. This means that people are making less today than they were in May 2021 (in terms of buying power).

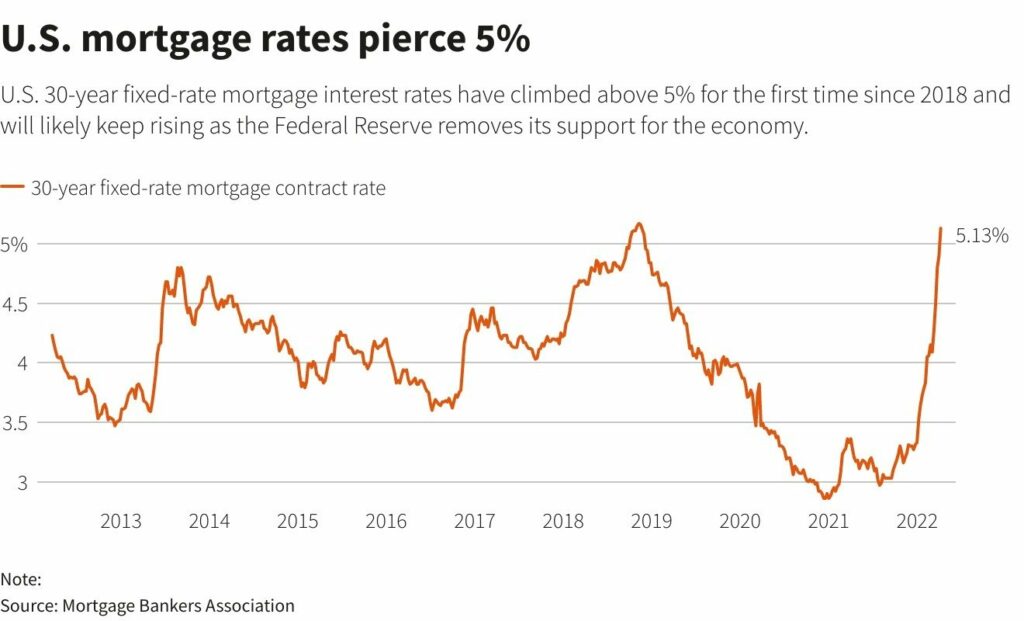
Mortgage Rates – Mortgage rates are now above 5% and are set to continue rising as the Federal Reserve has an aggressive rate schedule of rate hikes planned for 2022. This is important because the Fed is just starting its rate hike cycle.

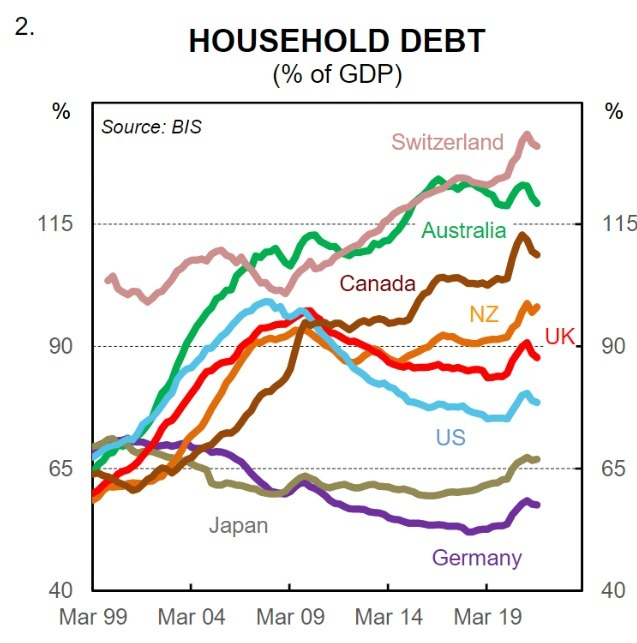
Household Debt – Total household debt is above 100% of GDP in countries such as Canada, Australia, and Switzerland (Meaning: the people owe more than the total country’s GDP). Higher Fed rates also mean higher revolving and floating debt rates for households.

Producer Price Index (PPI) –  Price index that measures the changes in prices received by domestic producers. In other words, what producers of goods pay for their raw materials. Year over year % change in PPI is now the highest it has been since the early 80s.

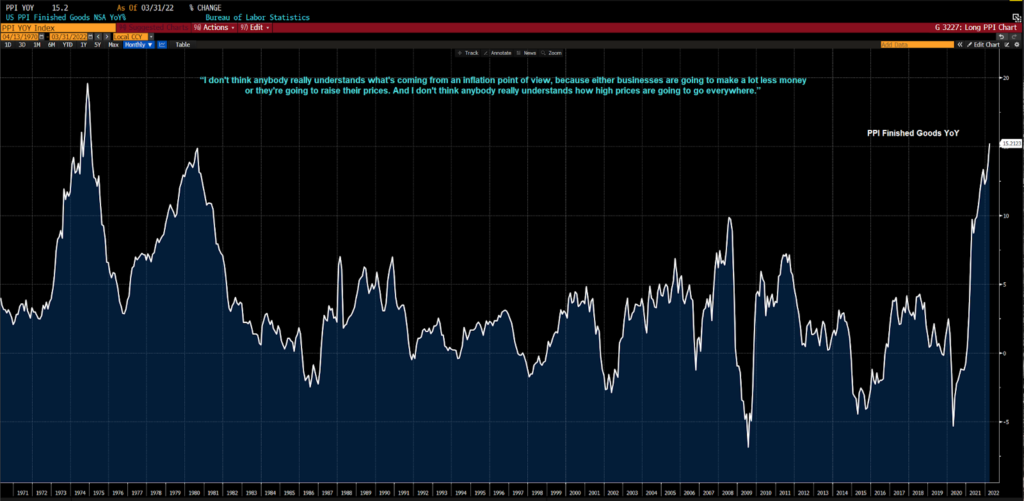
The Chairman of Restoration Hardware said it plainly:

“I don’t think anybody really understands what’s coming from an inflation point of view, because either businesses are going to make a lot less money or they’re going to raise their prices. And I don’t think anybody really understands how high prices are going to go everywhere.”

Some people remain bullish broader equities based on the idea that we are at peak inflation. I don’t see that as a reality as long as PPI keeps surging, because we have 2 options:

  1. Companies eat the price increases and margins collapse
  2. Companies pass on the price increases to consumers, inflation keeps rising (buying power continues to erode), and the Fed plans even more rate hikes.

What is my takeaway from all of this?

The world is in a very precarious position. The pundits that said “don’t fight the Fed” are now fighting the Fed. The same people who said the consumer is strong with 1.8% inflation are saying they’re still strong at 8.5% inflation. 

My point is we’re not only seeing perma-bulls we’re seeing perma-BS, and there are already warnings of a flagging market. Netflix is ~70% off its highs, wiping out 4 years of gains in a few weeks. JP Morgan shares are down ~40% after last week’s earnings showed a slide in profits.

You can see from the chart below that JPM’s stock is highly correlated to the S&P 500. Are these stocks the proverbial canary in a coal mine?

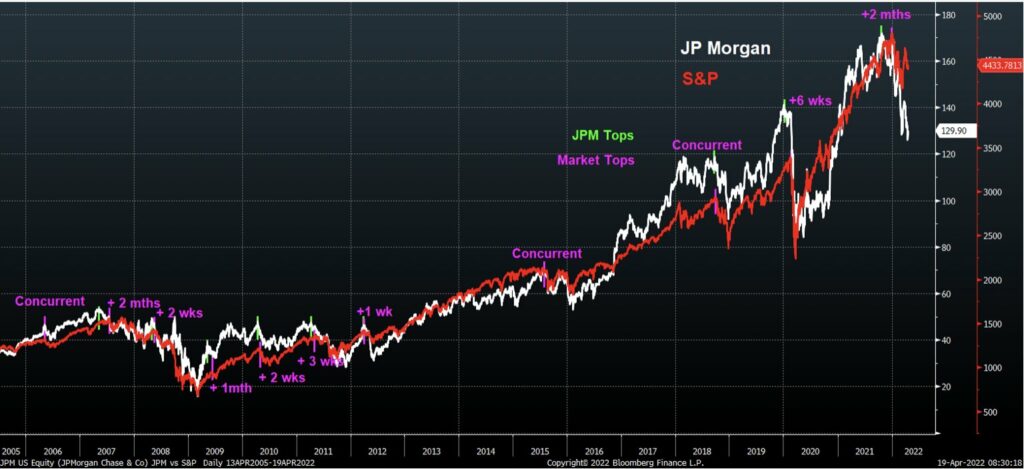
That remains to be seen.

I do not know if the market will sell off tomorrow, in 7 months, or if it’ll mostly trade sideways for the next few years. 

What I do know, is that when the market turns over, it will be time to own precious metals. I am a firm believer in gold as an antifragile investment – which we have talked about at length over the past several months.

“Antifragile is a property of systems in which they increase in capability to thrive as a result of stressors, shocks, volatility, noise, mistakes, faults, attacks, or failures.” – Nassim Taleb 

For gold, this means that as volatility and uncertainty increase gold strengthens.

The world is entering tumultuous times. I know many of you are disappointed in the recent performance of precious metals miners, but  I expect the tides to be turning over sooner than later.

Picture of Jamie Keech

Jamie Keech

CIO; Editor

Picture of Nick D'Onofrio

Nick D'Onofrio

Head of Research

Facebook
Twitter
LinkedIn

Golden Shield – What a Result!!

Golden Shield – What a Result!!

Golden Shield drilled 50 m grading at 9.1 g/t gold at Mazaoa Hill, Marudi. This is possibly the best drill result that we have seen out of any Ri holding to date (rivaled only by Vizsla). 

Those of you that have watched my podcast with Francis MacDonald will remember that he talks about a concept called GT or Grade Thickness. (I highly recommend watching to learn about this metric).

GT  = grade (g/t) x thickness of a drill hole (m)

It is important to note that thickness isn’t the entire length of the drill hole, but the portion of the drill hole that mineralization occurs over.

In this scenario, the GT = 455 = 9.1 g/t x 50 m.

To put this into perspective, the majority of:

  • +2Moz gold deposits have initial GT intersects of +50GT; and
  • +5Moz gold deposits have initial GT intersects of +134 GT.

To capture the majority of +5Moz deposits, discovery intersects should have +10m of mineralized rock. This is because, for big deposits, you generally don’t want to be chasing narrow high-grade veins. It is more profitable to mine larger wide veins.

A GT of 455 is 3.4 times higher than the much sought-after 134 GT metric.

Equally importantly the “new discovery” is not a “twinned hole” or simply re-drilling a previously known deposit, this hole represents a meaningful expansion of the known mineralization. Simply put, this is a banging drill hole and indicates that there is probably a lot more gold at Marudi than previously expected. 

Leo Hathaway, the executive chairman, who has found multiple gold mines working with Ross Beaty, said that this is the best drill result he has ever seen out of an initial drill program.

My comment: YESSSSSSSS!!!!!

The share price has bounced back to ~$0.80, more muted than we’d like to see, but remember this company is not yet listed on the OTC markets, meaning it is challenging for USA inventors to buy this stock. I expect significant buying when the OTC cross-listing is complete (soon I’m told!).  

In summary: I’m very excited about what’s happening at GSRI.  

Congrats to all Members who participated in this deal, I expect our patience will pay off!

What We‘ve Been Waiting for… Unfortunately.

Over the past decade, as tech stocks reached insane heights, the world seemed to forget that we actually need commodities to, you know, do anything.

But such is the fickle nature of the markets.

Commodity markets are cyclical, the pendulum swings from side to side as the market tries to balance at an equilibrium point. For the past several years the pendulum has been artificially pushed in one direction…  But now it’s swinging back with a vengeance.

Fortunately at Ri, we’re ready for this violent move.

It was easy to predict as the world has trended away from globalization towards a protectionist/nationalist view. 

We saw examples of this with:

  •  Brexit; 
  • The renegotiation of NAFTA;
  • Trade wars between the US and China; and
  • The election of Donald Trump. 
  • Today, our anti-globalization fate has been sealed by Russia’s invasion of Ukraine.

The geopolitical battle for economic dominance has evolved into an all-out war. The Ukrainian war is showing signs that it is not just about Ukraine. It’s not even Russian vs. American. More accurately, it is about authoritarian empires vs. the democratic West. 

Whether this specific conflict in Ukraine escalates or cools off, the world is forever changed. 

The fissures that are growing each day are not easily healed. The damaging impact of sanctions and supply chain disruptions will have far-reaching consequences. Alliances are being formed for the decades to come that will influence trade, travel, economic activity, and global power dynamics.

Globalization has been dealt a mortal blow, as have the disinflationary benefits that accompany it. The financial implications are immeasurable and compounding daily. 

The world has entered an environment where energy and food independence is a top priority. A key component of global power will be the control of critical commodities and resources. China has been aware of this for a long time and controls significant mineral, energy, and agricultural resources globally, Russia is positioned as an energy and resource nation – the West, after decades of neglect, has a long way to catch up.

It will take years for this to become a reality. Expect much higher costs (inflation) and a continued shortage of goods we used to take for granted. Each of these “ruptures” will have second and third-order effects the impacts of which are as yet unknown. 

But the coming chaos also represents one of the greatest investment opportunities of our generation. 

Bear down.

Commodities price movement is accelerating rapidly.

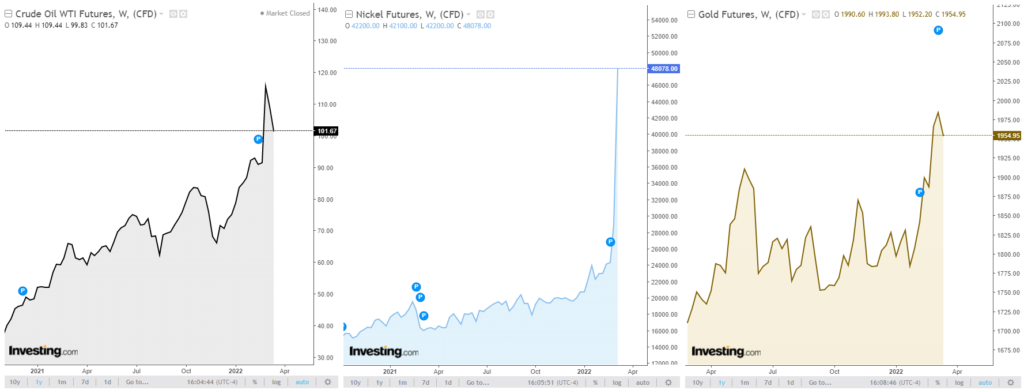
But, commodity equities have barely budged.  Believe me –  this is a good thing for us

Miners, especially junior miners, are always delayed when commodities start to run, but when they do move it tends to be violent. Commodity runs very often coincide with global uncertainty, in this scenario capital pulls out of the market and assesses where to “re-deploy” and the answer: The companies that actually produce commodities.  

And, there is a long way to go for the relationship between the S&P 500 and commodities to normalize. Even with many commodity prices reaching new all-time highs, the data suggests that the real move in commodities is just getting started.

(Data as of March 7, 2022)

We have an unbelievable buying window, and I intend to take full advantage of it. 

Picture of Jamie Keech

Jamie Keech

CIO; Editor

Picture of Nick D'Onofrio

Nick D'Onofrio

Head of Research

Facebook
Twitter
LinkedIn