Resource Insider

A trade so obvious even the U.S. gov. can see it…

Resource Insider

A trade so obvious even the U.S. gov. can see it…

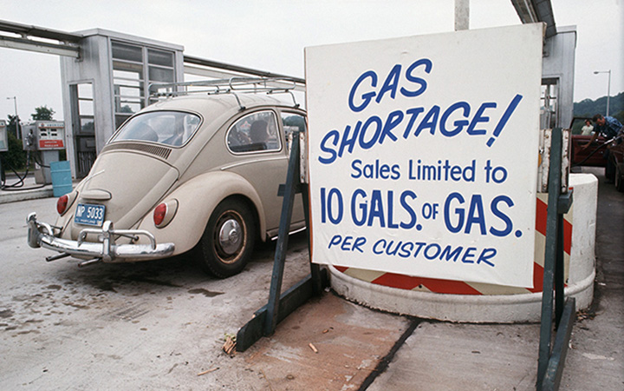
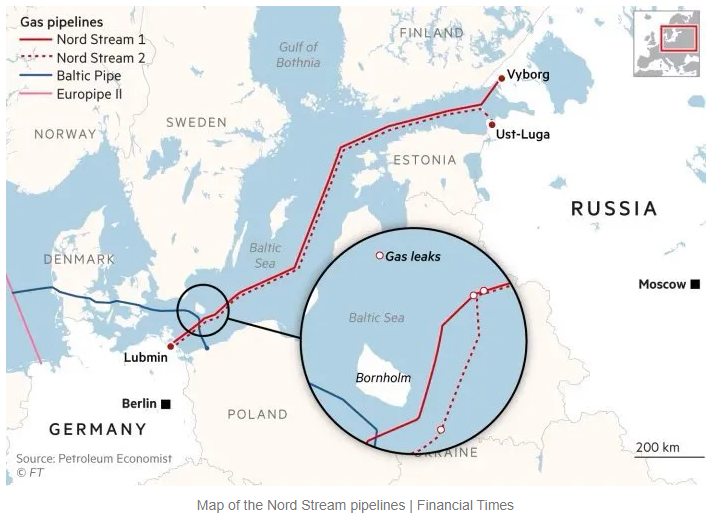
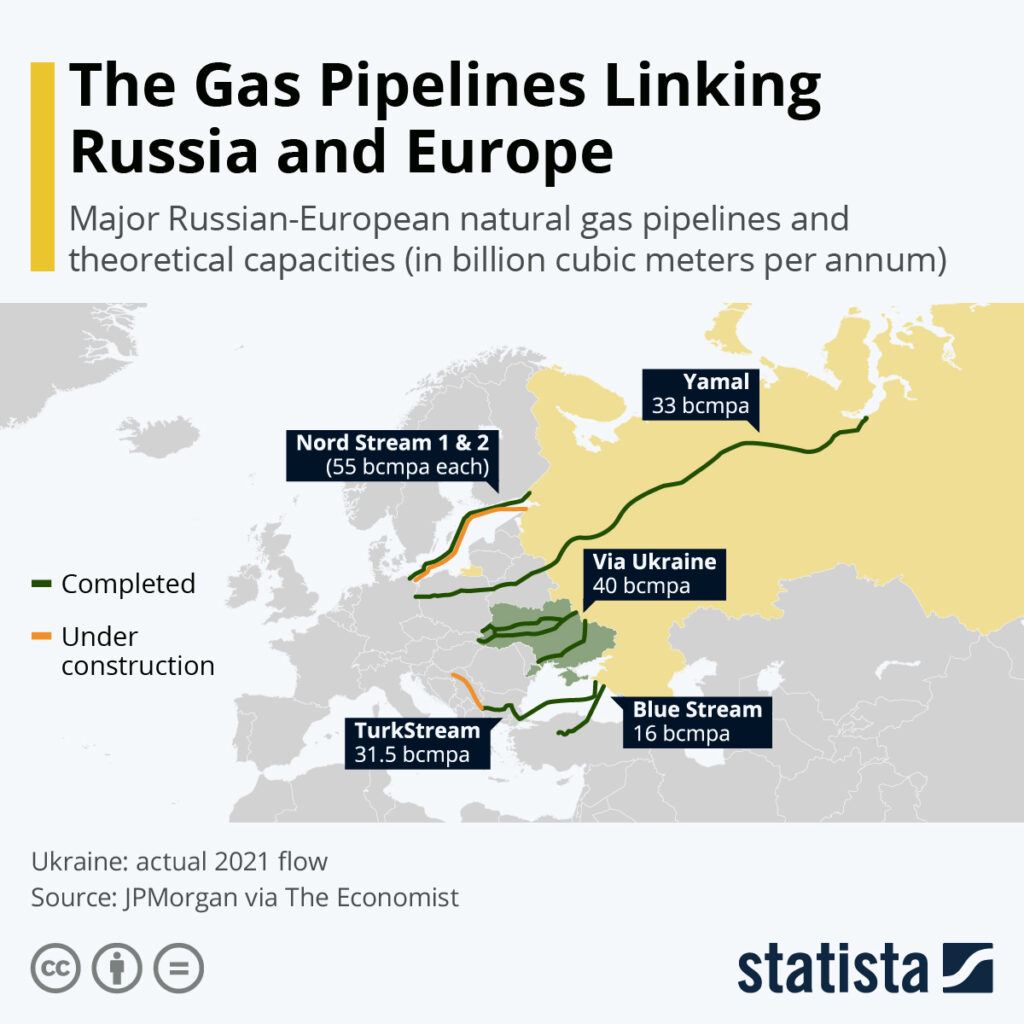
When Russia turned the nat gas taps off things got ugly.

  • Europeans saw their energy bills go from €250/month to more than €2,500/month.

  • Energy costs skyrocketed from under €100 / MWh to +€1,000 / MWh in some EU countries.

  • Liquid Natural Gas (LNG) import prices shot up from €7 in 2021 to €70. 

Corporations, individuals, and utilities felt the pain.

To ensure that there would be enough natural gas to keep the lights on, many fertilizer companies were forced to cut production by 50%. The effect on crop yields are still to be seen. 

Then, there was relief.

It’s better to be lucky than smart… 

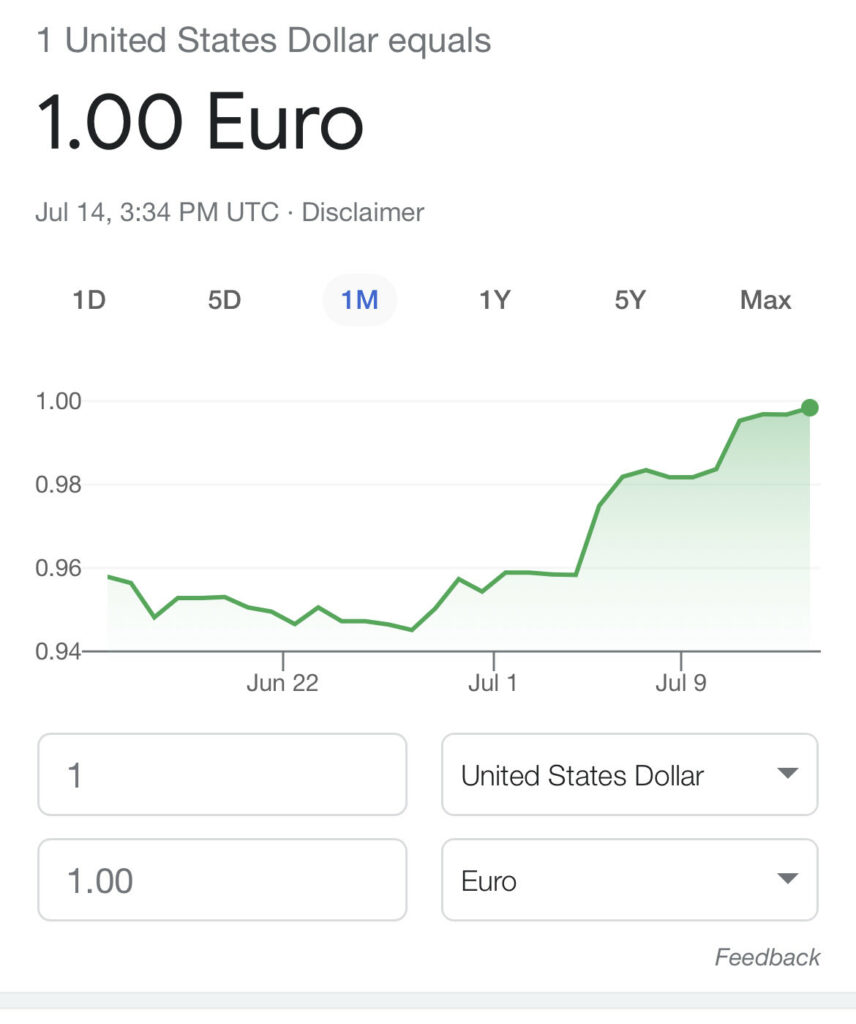
Europe got lucky, and had the second mildest winter on record – which brought energy prices down to pre-invasion levels. 

A blessing for European energy bills and an opportunity for savvy investors.

This wasn’t a stay of execution… just a delay. However, it has given the West more time to come up with solutions – one of which is U.S. LNG imports.

The Freeport LNG terminal, which was shut down due to a fire and explosion in June of 2022, is ready to come back online. This will be a major source of LNG exports heading to Europe. 

Added EU demand will put price pressure on U.S. natural gas. 

There is a high probability that a significant price move could occur in the North American natural gas markets over the next 12 months.

Last summer we saw U.S. natural gas prices break $7.00 / mcf for the first time in 14 years.

State of the (natural gas) Union.

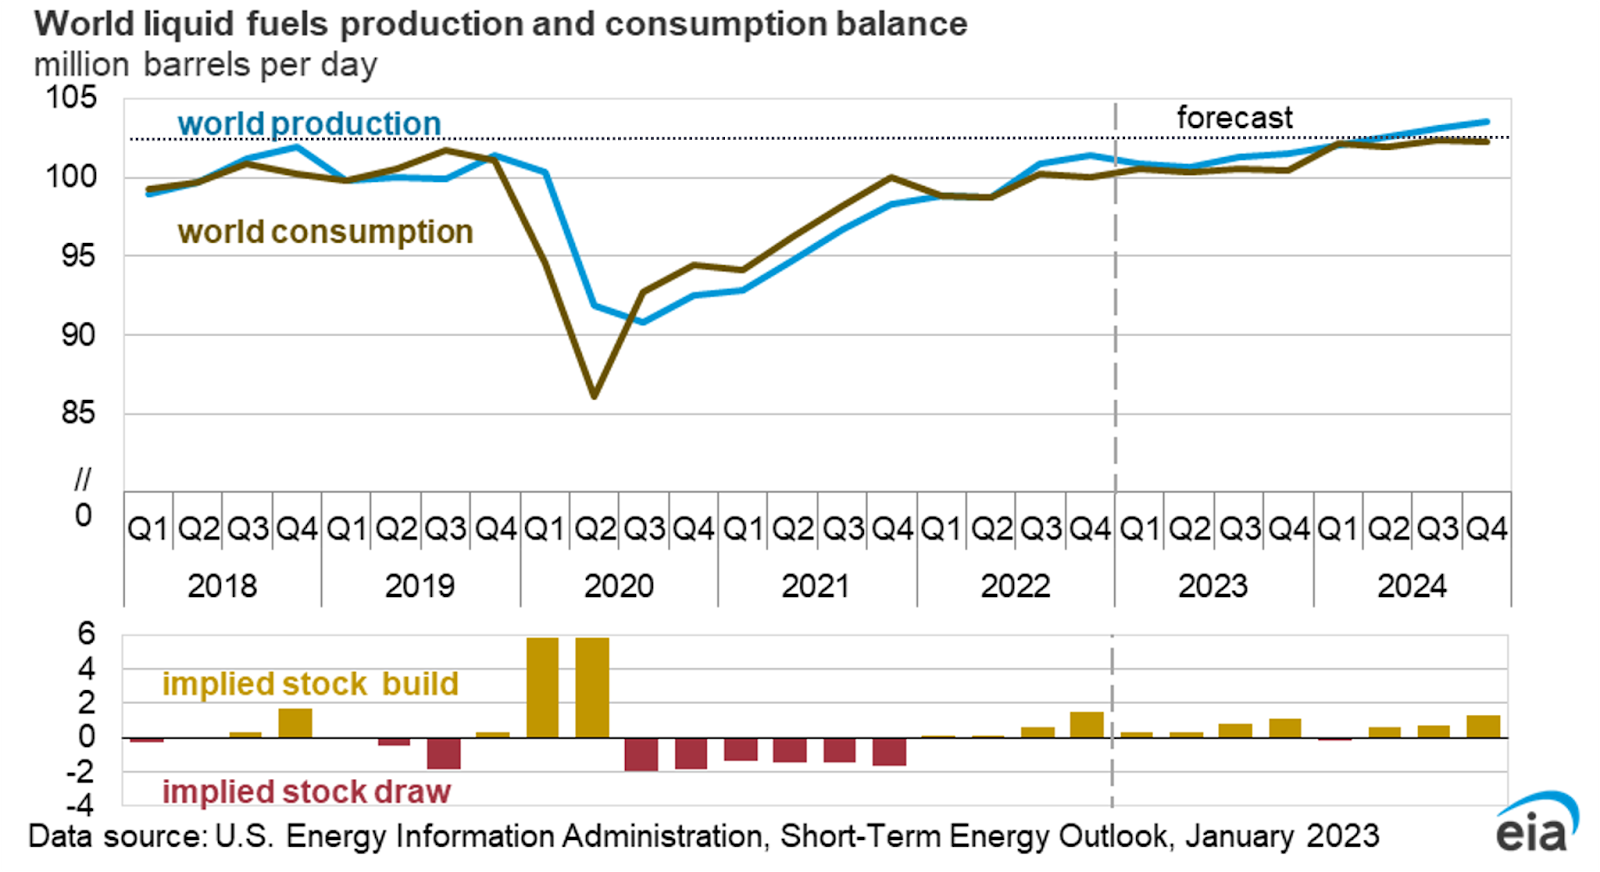
We have been convinced that U.S. oil and gas production growth would stall and eventually turn negative, delivering a major hit to US energy supply. This thesis has been largely driven by the research of our friend Scott Lapierre – a world class petrophysicist that we had on the Ri Podcast 3 years ago. 

So far, things are playing out as we expected. 
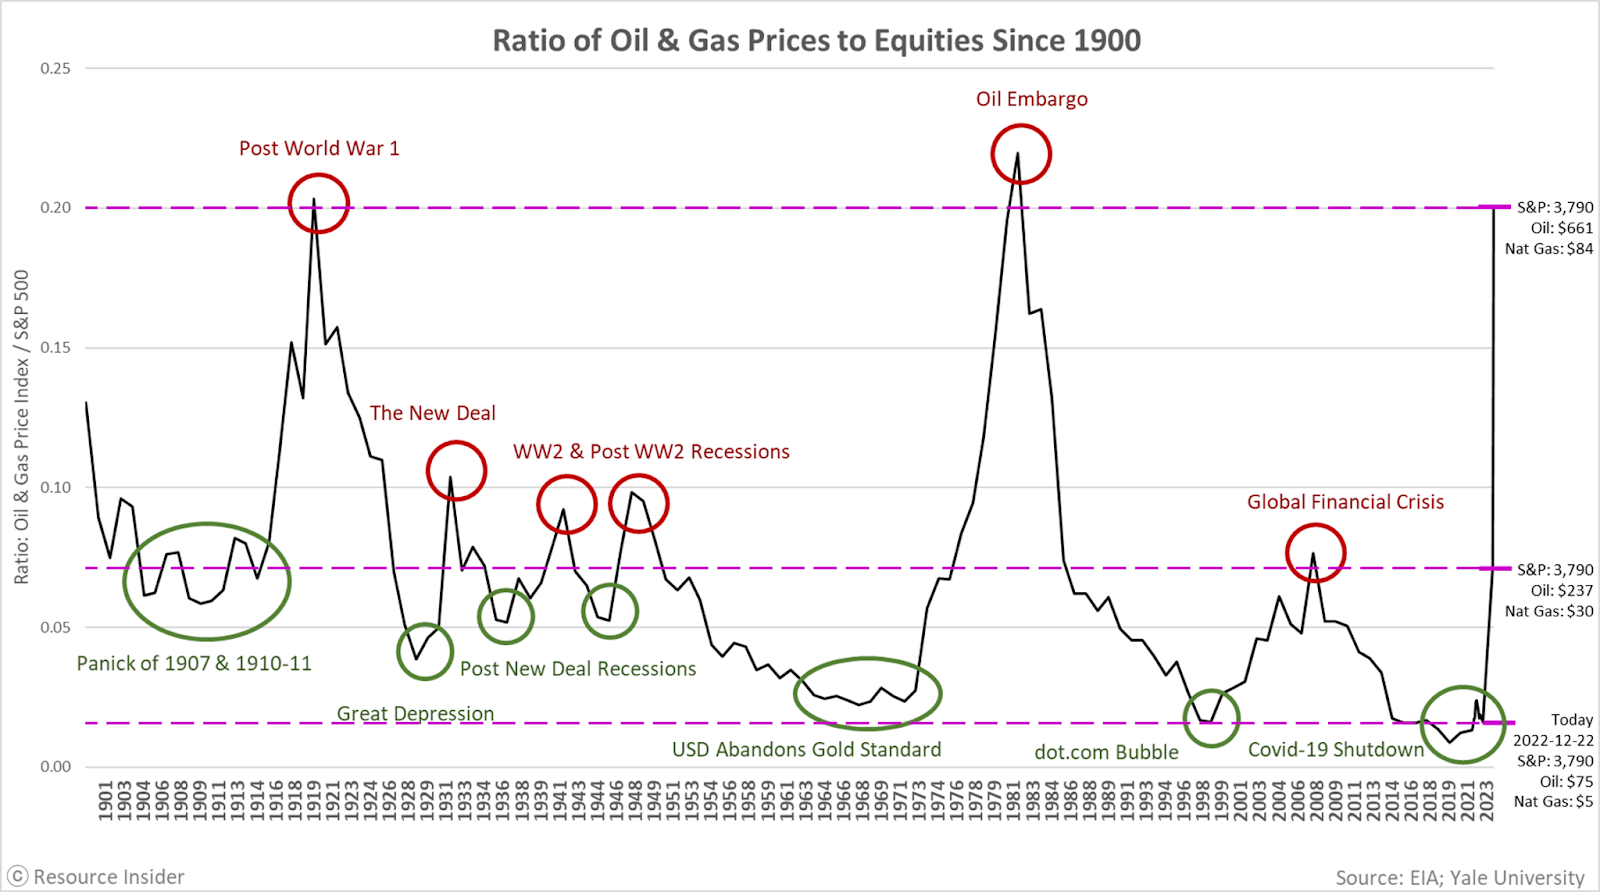
Peak Oil

Today many analysts refer to peak oil demand, but originally peak oil referred to supply

The idea of a basin’s peak oil supply is associated with a controversial Royal Dutch Shell geologist from the 1950s named M. King Hubbert. He believed that an oil or gas field’s production resembles a bell-shaped curve.

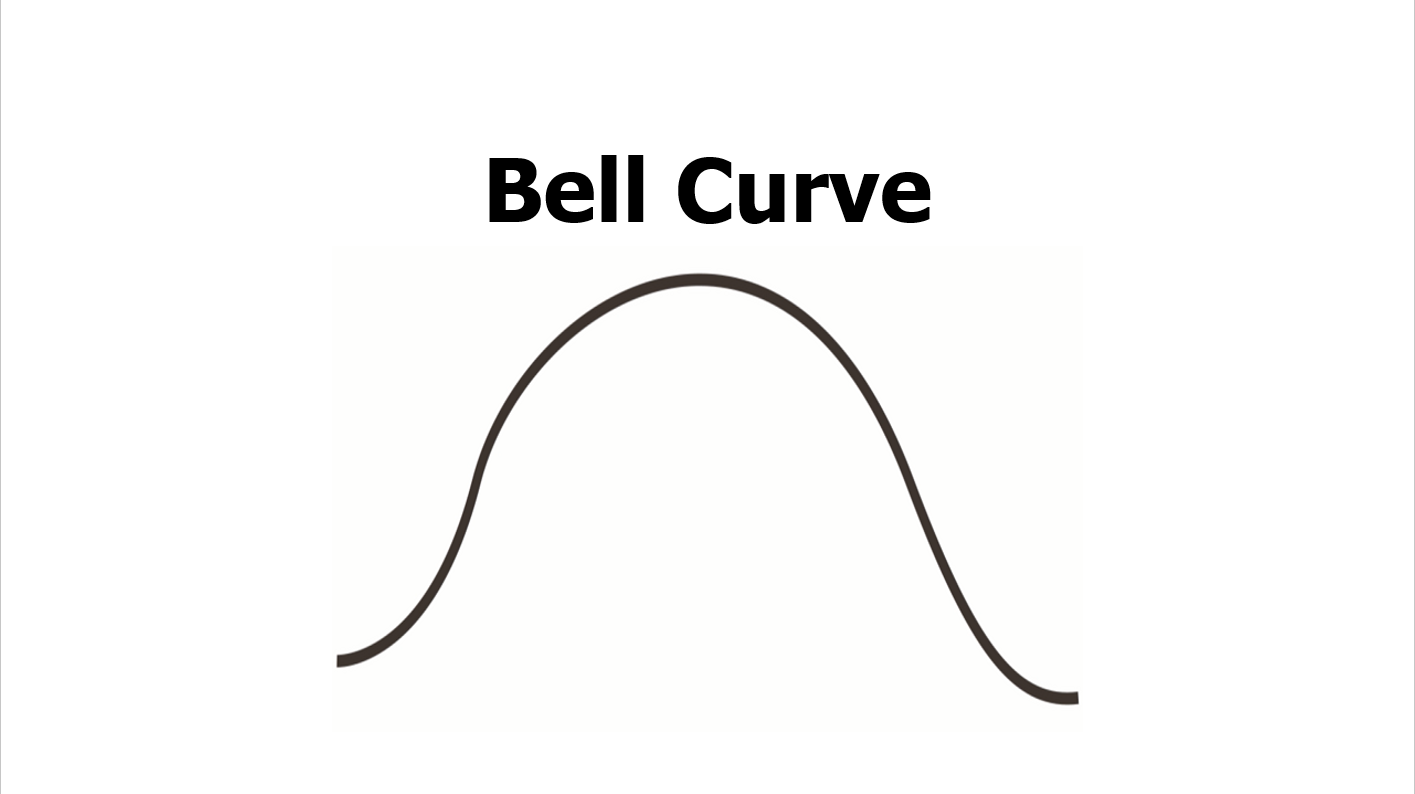
Hubbert expected a field’s production to increase at an accelerating rate, level off / plateau, and then decline at a rate similar to its growth phase. 

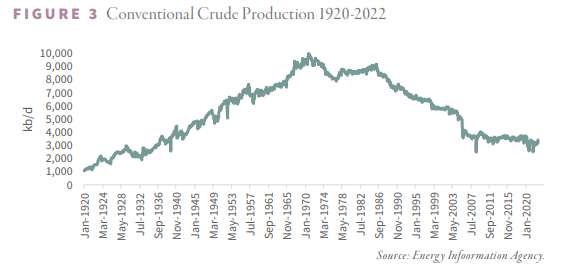
In 1956 he predicted that U.S. crude oil production would peak in the 1970s at around 10 mm b/d. In 1970 when U.S. production did peak at 10 mm b/d, his work gained widespread attention. 

From 1970 until 2008 U.S. oil production declined, until a new type of basin came into the limelight…

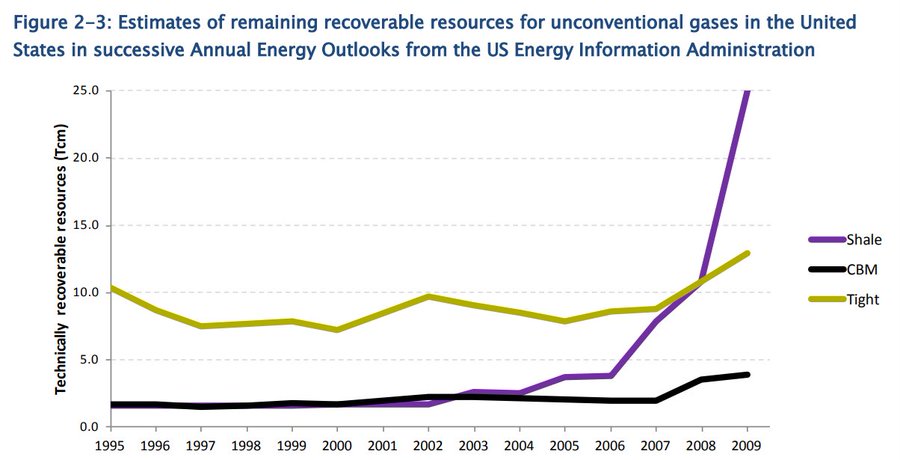
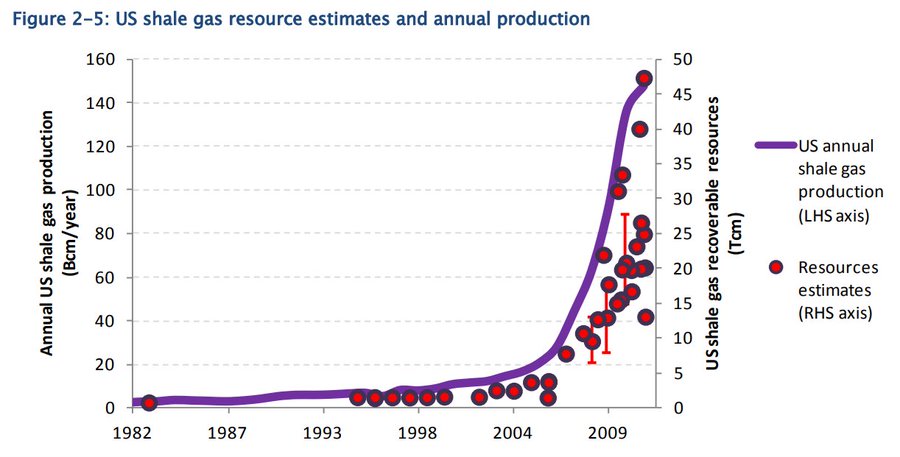
U.S. Shale Oil & Gas

When hydraulic fracturing (aka: fracking) came on the scene, shale oil and gas became huge. In return, the U.S. became the largest producer of oil and gas in the world.

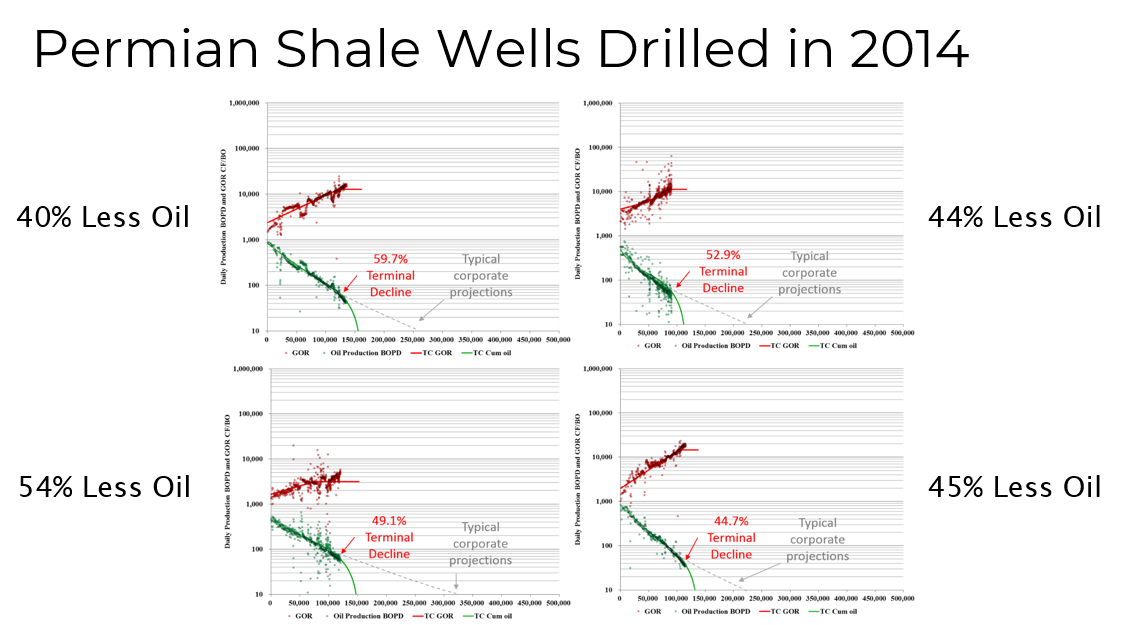
But, we believe the theory of a bell shaped production curve still holds true for fracked wells, just like it did for conventional oil and gas.

If we’re right… We’re running out of O&G. 

Our own controversial geologist, Scott Lapierre, has been pounding the table warning investors of declining shale production. 

Scott came to this conclusion independently of Hubbert’s ideas. Scott’s ideas arose from first principle calculations using the physical properties of oil, gas, and the rocks that trap it.

If both Scott’s science and Hubbert’s theories are correct, it could mean U.S. oil and gas production could fall as fast as it rose since the onset of fracking. 

The proof is in the pudding.

The two earliest shale basins, the Barnett and Fayetteville, saw peak production between 2011 and 2014. Since, they have each declined by 70%. 

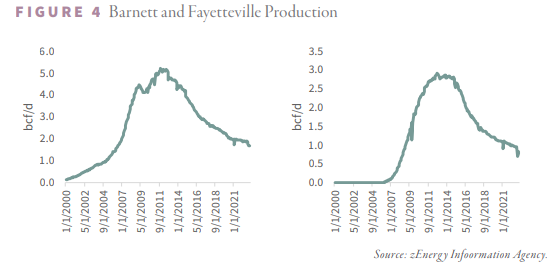
Both of these early shale basins were gas fields. 

What does this mean?

The days of cheap natural gas in the U.S. are over. 

The next largest natural gas fields are the Marcellus and the Haynesville. 

The Marcellus is following Hubbert’s bell curve model, having reached its plateau in 2020. Over the last twelve months, the Marcellus declined by 300 mcf/d. Hubbert models suggest that the Haynesville could plateau as soon as next year. 

Exploration is dead.

Natural gas drilling in the U.S. is near all-time lows. 

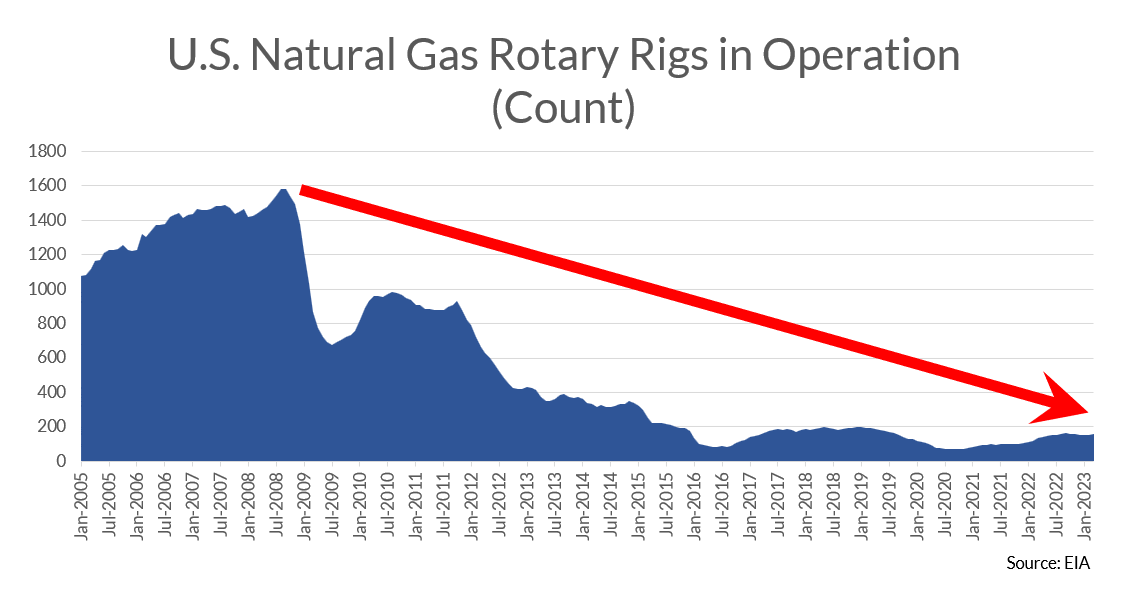
The number of active natural gas rigs in the United States has declined by more than 75% since 2014, resulting in U.S. gas production declining by more than 10% in the same period. 

Because of low energy prices, and a move towards clean energy, the appetite for hydrocarbon exploration has been dead. 

This leaves the U.S. in a precarious position… And natural gas prices are vulnerable to a surge.

We’ve been watching the U.S. energy sector for 3-years, searching for the right deals to get energy exposure through natural gas.

On a trip to Texas earlier this year, we finalized one of our next deals…

Project Patriot

This is a natural gas development opportunity in East Texas with an all-star team. 

The company is led by a gentleman that was groomed at a multi-billion dollar oil and gas company before he left to run his own deals. After a string of success stories, he is putting together his forth deal. 

On the technical side, this company is led by the geologist that literally wrote the discovery paper for the Haynesville-Bossier shale basin, where this deal is located. With her protege, she’s successfully drilled over 100 wells in the basin. 

Now, they’re at it again.

Jamie Keech

Jamie Keech

CIO; Editor

Nick D'Onofrio

Nick D'Onofrio

Head of Research

Facebook
Twitter
LinkedIn

“There’s no easy mining left—not in Chile nor the rest of the world.”

“There’s no easy mining left—not in Chile nor the rest of the world.”

If I had to choose one metal to own it would be copper. It’s essential to nearly everything, but more importantly we’re running out…

There are two trends driving copper demand:

  • The energy revolution (AKA the electrification of energy)

  • The urbanization of underdeveloped countries (primarily Asia and Africa)

To meet demand we’re going to need to mine more copper over the next 27 years then we’ve mined in ALL of human history to date.

That would be a challenging task even IF we had the copper reserves… the problem is, we don’t.

Copper production is falling at the world’s biggest mines. 

Codelco, the Chilean government-owned copper miner, is the world’s largest copper producer. And, Chile is where most of the copper comes from. 

Things are not going well. 

Production is at its lowest in a quarter century, costs have surged, and profits have slumped – all at a time when the world’s need for copper is greater than ever. 

Codelco’s production fell more than 10% in 2022 and is set to fall another 7% this year, to 1.35 million metric tons. 

This is more than a 20% drop from six years ago.

But, it is not only Codelco, ore grade is deteriorating around the world as existing deposits are mined and new ones are more difficult and costly to develop. 

Codelco’s CEO said “There’s no easy mining left—not in Chile nor the rest of the world.”

Global production issues confirmed.

I came across an interesting Twitter thread looking at Q1 2023 financial statements from the biggest copper producers


Copper production from Q1 2023 to Q1 2022, production was down ~200kt. 

The biggest contributor to falling numbers is the fact that there is consistently less copper in every tonne of rock that comes out of the ground (Note: Percentage of copper per tonne of rock is known as grade.)

It is becoming more expensive to mine a pound of copper. Add to that the fact that energy and labor prices are skyrocketing. 

4 of the 8 copper companies that reported cash costs saw increases of more than 20% from last quarter…

Let that sink in.  20% increase in costs in 3-months. That is insane

All of this is to say one thing: the world’s future copper supply is seriously in trouble.

We need much higher copper prices to incentivize exploration and development. And remember, we can’t just turn on the taps and produce more Cu – It takes +10-years to bring a new copper mine online. 

Oh, BTW Inventories are running dry…

Below is a chart of global copper inventories over the past 10 years. The gray area is the high, and low range, the white line is the average, and the orange is the 2023 inventory level. 

This chart should scare you because it says one thing: the world has no copper inventories

In summary:

  1. Copper demand is stronger than ever.

  2. The world’s biggest copper miner is having major production issues. 

  3. Costs are up and production is down for the world’s top 10 biggest copper producers.

  4. Current copper inventories are lower than they have been in the past 10 years.

My takeaway is simple: Own copper or be poor.

I don’t want to be poor, and neither do Ri Members. That’s why we’re about to launch our next Ri Deal: 

Project Patriot

We have one objective with this deal: BIG GAIN HUNTING.

Kazakhstan’s Chu-Sarysu is the world’s 3rd largest sediment-hosted copper basin. Yet, the region has been largely unexplored since the 1970s, but that is changing as we speak. 

In 2018, the government overhauled the mining code, unlocking exploration in Kazakhstan for the first time since the collapse of the Soviet Union.

The team locked down some of the most interesting assets in the region and are applying a fresh, modern approach to discovery. 

  • Big Data – compiled and digitized the largest privately-held exploration dataset for Central Asia.

  • Machine Learning – applying predictive machine learning to datasets, optimizing for the most prospective geology.

  • Major Partners – They have signed a joint venture agreement with one of the largest copper companies on the planet.

They are ready to drill multiple porphyry copper targets. These are the type of geological formations that have the potential to become monster deposits. 

These are the types of deposits that took Filo Mining (FIL.TO) from a $200 million market cap to a $2 billion market cap. 


Jamie Keech

Jamie Keech

CIO; Editor

Nick D'Onofrio

Nick D'Onofrio

Head of Research

Facebook
Twitter
LinkedIn

The Case for Oil & Gas Royalties

The Case for Oil & Gas Royalties 

I recently invested into American Oil and Gas royalties

Here’s why:

  • Exposure to energy;

  • Exposure to the USA;  

  • Exposure to cash flow;

  • Exposure to assets NOT listed on capital markets;

Let’s dig in… 

The Case for Higher Oil

The investment case for oil and gas is pretty straight forward. It boils down to the this: 

Oil is cheap, but is about to get expensive.

We believe oil prices, compared to equity markets, will revert to the mean due to significant under investment in the sector.

We are now going to walk through the market conditions that got us to this conclusion.

FACT: Oil is Cheaper than ever.

We compare oil and natural gas prices to the S&P 500 because the ratio helps give us an understanding of the true cost of energy. 

When energy is “cheap” compared to the value of the S&P we can anticipate that over time this will correct. It will do so but either energy prices going up, or company valuations going down – either way you want to own energy in this environment as a means of protecting and/or growing your capital. The inverse is true when energy prices are “expensive” as we saw in the 80’s during the oil embargo. 

Theoretically energy should be priced so that investors and producers make enough money to justify operating and investing in new production. But, cheap enough that consumers are not gouged at the pump and can maintain a comfortable life. 

But markets do not exist in a state of equilibrium. The pendulum swings back and forth. 

Right now energy is objectively cheap. 

Nothing in life is certain but based on historic data we expect the pendulum is about to swing the other way. 

The chart below shows the price of oil compared to the S&P 500 since 1900. 

Today the price of oil is ~$75/bbl and natural gas is ~$3/mcf while the S&P 500 is trading at 4,000. 

Before 2020/the pandemic, oil and gas prices were the cheapest in recorded history when compared to the S&P 500. 

If the ratio swings back to 2008 levels at today’s S&P 500 levels then oil will be ~$240/bbl and gas ~$30/mcf.

If the ratio reaches 1918 or 1980 levels… then the world is in for a world of hurt. Oil prices will be ~$660/bbl and natural gas will be $84/mcf. 

Now, I think it is unlikely that oil prices will spike without a simultaneous pull back in the S&P – but even still I wouldn’t be surprised if we see oil prices above $150/barrel.

Even if oil prices don’t move at all (unlikely in my opinion), in the event of a major pull back in listed equities energy should act as a safe haven for capital. 

Why is Oil so Cheap?

Horizontal fracturing (AKA fracking) came on the scene in a big way in the mid 2000s. 

Between 2005 and 2010 the shale-gas industry in the United States grew by 45% a year. In 2005 shale gas production made up just 4% of the USAs overall gas production, by 2012 it accounted for 24%.

Meanwhile, oil prices were high. In 2008 oil price shot up to more than $140/bbl. Prices briefly crashed later that year, but quickly recovered and consistently traded around $100/bbl until 2014. 

From 2005-2014 the frackers were printing money – the likes of Harrold Hamm of Continental Resources (CLR) developed the Bakken, Tom Ward and Aubrey McClendon of Chesapeake Energy (CHK) built the 2nd largest natural gas producer through a levered land grab, Charif Souki of Cheniere Energy (NYSE: LNG) built the first U.S. LNG export terminal, and Scott Sheffield at Pioneer Natural Resources led the development of the world renowned Permian Basin. 

Horizontal wells came online with huge volumes of oil, but were expensive to drill.

Then the problems started.

Banks allowed the frackers to borrow against their estimated oil reserves, and so they did.

Frackers would drill, hitting oil nearly every time, but unknowingly (to most) they were significantly overestimating their reserves. 

The result?

Wells would “run dry” sooner than expected… There was a lot less accessible oil than anticipated. 

The above charts demonstrate well decline rates occurring far faster than anticipated. 

Which is not good when borrowing based on expected production. 

So what did they do?

Naturally, they drilled more wells to keep production high and meet debt payments. Inadvertently creating a pyramid scheme, with the revenue generated by new wells was required to pay off the debts on the old wells. 

They drilled to borrow, and borrowed to drill. 

Companies relied on rising oil prices to bail them out. But inevitably the sheer volume of oil that was being produced ensured that maintaining high prices was impossible. 

More Supply = Lower Prices.  

By 2018 the U.S. had grown to be the biggest oil and gas producer in the world. 

A Change of Heart

Executive bonuses were tied to production, not profitability. Which brings to mind one of Charlie Munger’s favorite sayings “show me the incentive and I will show you the outcome.”

During the Covid Crash, when oil prices went negative,this all changed and executive compensation was restructured. Today, compensation is driven by profitability. 

This means more disciplined balance sheets with less debt (aka less drilling). In turn, capital discipline will lead to less production, higher oil prices, and more profitable companies.

The Rusky Bailout

Then Russia invaded Ukraine and oil prices skyrocketed, saving many companies. 

They took this opportunity to pay down debt, hedge production at higher prices, and start telling a different narrative (closer to the truth) to the market. 

The truth is that they had  “high-graded” all of the U.S. shale plays. This means that they have drilled the best and most profitable shale locations trying to make ends meet. What’s left is lower quality acreage. 

This means that the U.S. shale production outlook is in bad shape. 

Speaking at a Goldman Sachs energy conference in Miami, Scott Sheffield, CEO U.S. shale giant Pioneer Natural Resources, said that the company has lowered its 2030 total Permian Basin oil production forecast from +8 million b/d to ~7 million b/d.

This indicates a significant slowdown in annual U.S. oil production.

Lower production means higher prices. 

Will drilling come back?

It is going to take time for drilling to come back in a big way. The world at large has mismanaged invested in the energy space for two main reasons:

  1. The Green Energy Transition

A willful blindness has infected the western world, with the claim that oil demand is somehow going to disappear in 5 or 10 years. 

This is highly unlikely. 

Two decades of aspirational policies and trillions of dollars in subsidies, most of it on solar, wind, and battery technologies, have yet to produce anything close to an energy transition that eliminates hydrocarbons.

Over the last 10 years $3.8 trillion has been poured into renewables, yet fossil fuel dependence has only been reduced by 1% (82% to 81% of the overall energy consumption).

The IEA (International Energy Agency) noted that an energy transition is “a shift from a fuel-intensive to a material-intensive energy system.” 

They estimate the world will need to increase the supply of minerals such as lithium, graphite, nickel, and rare earths by 4,200%, 2,500%, 1,900%, and 700%, respectively, by 2040. 

The world will need dozens of new world-class mines for all of these minerals, requiring tens of billions of dollars of investment to develop. 

On average, it takes 16 years to bring a mine from exploration to production. So, even if we had the technology (which we don’t) and the mineral reserves (which we don’t), it is nearly impossible to provide the materials required to replace hydrocarbons for energy demand in the next 10 years.

In the interest of time I’m not going to touch on the inefficiency and the intermittency issues of  renewable energies here… Instead just ask your German friends how it’s going. 

  1. Poor Returns

The frackers were so far off on production estimates that many investors watched their money get torched by aggressive  drill programs. 

Once upon a time any semi competent wildcatter with a half-baked idea could call up an energy PE fund and walk out with a $100m cheque. Today it is nearly impossible to find private equity money willing to drill new wells. Their mandates have been changed to buy production (where they can accurately calculate reserve estimates). 

To give you an idea of how far off historic reserve estimates were, today banks discount all future annual production by 10% then discount reserve estimates by 50% before calculating how much they are willing to lend. 

To incentivize this sort of investing again, oil prices are going to have to move MUCH higher. 

What about today?

The lost energy production resulting from the Russia/Ukraine war  is just the start. China’s reopening is about to shock the oil markets once again. 

Since China reopened, the International Energy Agency (IEA) increased its 2023 forecast for oil demand growth by nearly 200,000 bbls/day to 1.9m bbls/day. 

The IEA now expects 2023 total oil demand to average 101.7m barrels/day – setting new record highs.

We have already talked about that OPEC+ has been cutting production. But that’s just the tip of the iceberg…. 

Saudi Arabia is saying that they are maxed out on production – meaning, they don’t have the capacity to produce any more oil than they are currently producing. 

Why Now?

The Russians are off the board, the Arab world is tightening production, the Chinese are ramping up the economy all whilst oil demand is peaking and USA energy reserves are dwindling. 

This confluence of events has made me want to get long U.S. energy production. 

BUT I want to minimize risk so I’ll be using an investment instrument you’re all familiar with: royalties

Jamie Keech

Jamie Keech

CIO; Editor

Nick D'Onofrio

Nick D'Onofrio

Head of Research

Facebook
Twitter
LinkedIn

BP & the 100 Year Showdown

BP & the 100 Year Showdown

In 1872 William Knox D’Arcy had the good sense to marry Elena Birkbeck of Rockhampton, the daughter of a successful mining engineer. After a decent legal career D’Arcy was launched into the world of  gold speculating.

In this, it turned out, he had a special talent.     

By 1889 he was worth £711,000,000 (in today’s money). Most decent Englishmen would retire to their country estate to drink gin and smoke cigars when they achieved filthy rich status… 

Turns out this was only D’Arcy’s opening act. 

Black Gold

In 1900 with the help of a few associates and the grand sum of £20,000 (worth ~US$2.9 million today) D’Arcy and crew locked down the oil rights to nearly the entirety of Iran (1,200,000 km2). In exchange D’Arcy promised Iran 50% equity ownership, including 16% of any future net profits.

 In 1908 he struck oil and the money started rolling in.

But, as Europe descended into World War oil became a strategic resource, prompting the British government to buy a controlling stake in D’Arcy’s venture, effectively nationalizing British oil production in Iran. In 1935 the company was renamed the “Anglo-Iranian Oil Company” (AIOC).

But…  All was not well.  

Throughout Iran discontent was brewing over the management of AIOC, seen as a tool of British imperialism.

The Brits didn’t do themselves any favors; refusing to allow the AIOC’s books to be audited they left the Iranian government with no way of knowing whether they were being paid what they were promised.

But that was about to change…

In 1951, Mohammad Mosaddegh was elected as the 35th Prime Minister of Iran. 

Mosaddegh wouldn’t take no for an answer. When the Brits refused to cooperate, the Iranian parliament voted to nationalize Iran’s oil industry, including the British-built Abadan oil refinery – the world’s largest refinery at the time.

The nationalization of AIOC meant the Iranian government took total control and ownership over the company and its assets.

Calling in the Kermit

This did not sit well with King & country back in the UK. 

Following the nationalization of AIOC, Britain instigated a global boycott of Iranian oil.The UK and US saw Mosaddegh as unreliable and potentially a communist.

Mosaddegh confirmed their fears by dissolving Parliament, giving himself complete control, whilst stripping the Shah (AKA the Iranian King) of any power. 

Mosaddegh granted himself total dictatorial power.

UK prime minister Winston Churchill and the Eisenhower administration now had the excuse they needed to overthrow Mosaddegh’s government and put AIOC back in the hands of Western business owners. The Shah (Reza Shah Pahlavi), who had been reluctant to support the CIA’s demand for a coup, finally agreed to support it. 

In 1953, Mosaddegh’s government was overthrown by MI6 and the CIA, in an operation led by Kermit Roosevelt Jr. (President Theodore Roosevelt’s grandson).

Following the coup, the Shah reigned as leader of Iran and implemented a series of economic, social, and political reforms. He was the founding father of modern Iran as he replaced Islamic law with western law, and forbade traditional Islamic clothing, separation of the sexes, and veiling of women (hijab).

Yes, yes, he was still a dictator, but he was OUR dictator! And most importantly he let the Brits keep their oil!

Oil & Policy

In 1954, Anglo-Iranian Oil Company was renamed once again; to the British Petroleum Company  or “BP.”

When the Shah took power, the British-led oil embargo ended and oil revenues ripped. 

The Anglo-Iranian Oil Company’s monopoly was replaced with a group of corporations that included British Petroleum and eight European and and American companies – called the Oil Consortium Agreement. 

Oil revenues increased from $34 million in 1954/55 to $181 million in 1956/57. 

Not bad for 24-months work. 

As might be expected Iran began to develop rapidly. Reforms resulted in decades of sustained economic growth that made it one of the fastest growing economies in the world. Growth that exceeded the United States, Britain, and France. All  while national income rose 423X. 

But… All good things come to an end.

Nobody likes a dictator… especially one whose reign has the look of a lavish orgy. Eventually the Shah’s total power led to resentment internally and externally. 

Crisis #1

Externally, The US stopped supporting the Shah when Iran supported OPEC’s (Organization of Petroleum Exporting Countries) 1973 oil embargo. This embargo caused the first oil crisis, causing  oil to jump from  $3/bbl to $12/bbl.

After the embargo in 1973, the Shah faced further tensions with the US after announcing he would not renew the consortium’s agreement, and planned to nationalize Iranian oil in 1979.

Internally, the Shah’s regime was seen as oppressive, brutal, corrupt, and lavish. The Shah was perceived by many as beholden to non-Muslim Western powers (i.e., the United States)… which makes sense, because he was. 

Out goes the money, in comes the zealots.

In 1975, oil prices dropped sharply and crushed Iran economically. Things deteriorated quickly due to high inflation and the country’s inability to pay back its debts (sound familiar?). 

Eventually, internal resentment led to the Iranian/Islamic Revolution in 1979 which replaced the Shah’s government with an Islamic anti-Western totalitarian theocracy under the rule of Ayatollah Khomeini. 

Crisis #2

This  led to the 1979/second oil crisis. During the second oil crisis, the fall of Iranian production led to a 4% drop in global oil production, which sent prices higher once again. Prices rose from $14/bbl to $39/bbl.

TODAY: A new wave of protests.

Protests in Iran have been going on for the past several weeks following the death of 22-year-old Mahsa Amini.

Amini was visiting family in Tehran, where she was arrested by Iran’s “Guidance Patrol” for wearing an “inappropriate” hijab. Amini was transferred to the “Moral Security” agency, which informed her brother she would be attending a “briefing class”, and released shortly after.

Amini never made it out.

Kasra Hospital announced Amini’s death after being in a coma for three days, saying she was brain dead on arrival. Police claim she died from a heart issue, but all evidence points to police brutality as the cause of death. 

Anger (rightfully) swept through Iran following Amini’s death, with people risking taking the streets in defiance.

Women burnt their hijabs, cut their hair and screamed “Women, life, freedom” and “Death to the dictator” .

Viva La Revolution!

This response is unprecedented for the last 40 years. The movement is quickly turningfrom protest to revolution

The current regime knows this and is responding with censorship and brutality. 

According to human rights groups, hundreds of protesters have been killed by government officials.

What comes next?

If Khameni’s regime survives, then the Joint Comprehensive Plan of Action (JCPOA), commonly known as the Iran nuclear deal, is almost certainly dead. The most recent discussions ended with German leaders saying that Iran’s nuclear deal with world powers “has no future and is not in line with reality”, also stating that they will not negotiate “with an inhuman regime that is completely rejected by its own people and has no legitimacy whatsoever.”

Khameni stated that “[The West] feel that the country [Iran] is progressing towards full-scale power and they can’t tolerate this.”

Under the JCPOA Iran agreed to dismantle much of its nuclear program and open its facilities to extensive international inspections in exchange for billions of dollars worth of sanctions relief. 

If the Iran nuclear deal dies, It is very possible Iran will charge full steam ahead towards building a nuclear bomb – strategically it will be their best insurance policy against invasion (think Russia and Ukrain). However, there is a very serious risk that Israel would launch a preemptive strike against Iran.

Crisis #3?

Beyond the very scary prospect of a brutal theocratic dictator having a nuke, a revolution in Iran would likely disrupt the global supply of oil for a third time. 

Russia’s invasion of Ukraine has thrown global energy supplies off balance, and a revolution in Iran has the potential to throw fuel on the fire. 

Russia and Iran are the world’s third and seventh largest oil producing countries; supply disruptions from either nation have major implications for energy markets. 

Spare capacity in global oil production has fallen to exceptionally low levels – meaning the world doesn’t have the ability to easily or quickly increase oil production in a meaningful way. 

Global spare production capacity has shrunk to just 1.5% of global consumption according to Saudi Aramco, leaving the market vulnerable to shocks from unexpectedly strong consumption/demand or any disruption to production/supply.

Where will new production come from?

Between 2010 – 2019 U.S. shale producers accounted for nearly the total increase in global crude production. Today these shale companies are opting to limit growth and enjoy higher profits from existing production. The majority of their land producing the cheapest oil has seemingly been drilled. 

Until there is an oil exploration boom, the world may be out of “cheap” oil. Leaving the future supply of oil and gas in a precarious state.

As Churchill said: “Never let a good crisis go to waste.” 

It’s time for investors, and ANYONE hoping to protect their hard earned capital, to start thinking seriously about their portfolios energy exposure.

Jamie Keech

Jamie Keech

CIO; Editor

Nick D'Onofrio

Nick D'Onofrio

Head of Research

Facebook
Twitter
LinkedIn

Is the World Short Oil & Gas?

Is the World Short Oil & Gas

Energy markets are the talk of the town right now, and for good reason.

Here are some headlines:

  • Nord Stream 1 and 2 are down
  • US petroleum stocks are below the 5yr range
  • OPEC+ cuts production by 2million bbl/d

Nord Stream

The Nord Stream pipelines connect Russia to Germany via the Baltic Sea. Nord Stream 1 historically supplied the EU with ~35% of the total gas imported from Russia; Nord Stream 2 (which was on track to be operational in the first half of 2022) is equally as large.

Both Nord Stream 1 and 2 are down after suffering catastrophic losses of pressure. No one is exactly sure what happened to the pipelines, but the Swedish Security Service said that they found evidence of detonations and have high suspicions of “gross sabotage.”

No matter who attacked the pipelines, the results are clear: Europe is in for a very tough winter.

It’s estimated that it will take at least 20-25 weeks just to get all of the materials and equipment in place to repair the pipelines. Meaning that there is no way to repair the pipelines for at least 6 months… Probably much longer.

This leaves Europe very short on energy heat homes this winter. Protesters are claiming  they will be forced to choose between eating or heating their homes.

The damage to the pipelines means that Russia just lost substantial physical capacity to transport natural gas to Europe, even if current sanctions are removed. With the loss of the pipelines, also comes the loss of any leverage for Europe to bring Russia to a compromise over the Ukraine invasion… Which just made this war much more complicated. 

We should all be paying close attention to the pipelines connecting Russia to Europe via Ukraine. These pipelines just became essential to the EU. 

If Ukraine was looking for leverage to join the EU and/or Nato… They just got it.

US Petroleum Stocks

The US’s Energy Information Administration (EIA) releases a weekly inventory report – this week’s was quite telling. 

Two noteworthy items:

  • Gasoline demand increased
  • Total petroleum stocks fell below the 5-year low once again

In short, demand is strong and supply is struggling to keep up in a big way. Petroleum stocks haven’t been this low since 2004.

What made this particularly  important is that  a few hours later it was announced that…

OPEC+ Cuts Production

OPEC+ is a group of 23 oil-exporting countries that decide how much crude oil to sell on the global market.

At the core of this group are the 13 original members of OPEC (the Organization of Oil Exporting Countries), which consist of mostly Middle Eastern and African countries. OPEC was formed in 1960 as a cartel, with the aim of fixing the worldwide supply of oil and its price.

Today, OPEC+ nations produce around 40% of the world’s crude oil; the two biggest producers being Saudi Arabia and Russia.

Just a few weeks ago it was reported that Russian President Vladimir Putin met with Saudi Crown Prince Mohammed bin Salman (MBS) suggesting that OPEC+ cut production.

Those suggestions became a reality as OPEC+ agreed to cut production by 2 million barrels per day. 

Given the fact that OPEC+ has struggled to meet their production quotas, this cut will more likely look like a cut of ~900,000 barrels per day to the current supply.

Most of that production cut will come from nations that have a complicated history with the west: Saudi Arabia (48%), UAE (16%), Kuwait (15%), and Iraq (11%).

What drove the production cuts?

The United Arab Emirates’ (UAE) energy minister, Suhail Al Mazrouei, said that the group was solely focused on avoiding an oil price crash similar to 2008. 

Mazrouei said “In Europe they have their story, in Russia they have their own story. We can’t  be siding with this country or that country.” 

With a recession looming OPEC+ is most concerned about keeping a finger on the pulse of global oil supply and demand to maintain profitable prices.

The takeaway?

Oil and gas prices will likely head lower in the short term if the world heads into a recession, but they won’t be staying low for long. OPEC+ is determined to keep prices high even in the midst of a recessionary environment.

Remember, recessions massively impact oil and gas markets. Inventories rise when, and only when, the business cycle slows; this in turn leads to lower production capacity.

The world is short on energy supply and any reduction in production capacity will have a longstanding impact on the market. This will only be righted through significant investment in new production.

Unfortunately, the US is working hard to beat the EU in the global “idiodic energy policy competition”. 

Here’s a short summary of some of the current administration’s noteworthy policy decisions:

  • Kill Keystone XL pipeline on Day 1
  • Drain the Strategic Petroleum Reserves (SPR) before midterm elections
  • Tell oil and gas producers to lower prices at the pump…. Seriously WTF?!?!
  • Beg Saudi Arabia and Russia to produce more oil
  • Contemplate banning exports on refined products and gas
  • Lift Venezuelan sanctions to import more oil

If you’re not long oil, you might want to reconsider… 

Jamie Keech

Jamie Keech

CIO; Editor

Nick D'Onofrio

Nick D'Onofrio

Head of Research

Facebook
Twitter
LinkedIn

Silent Warnings in Real Estate

Silent Warnings in Real Estate

We’re in the midst of stagflation with a recession looming and the Fed has been unrelenting in raising interest rates. 

Big Problems are Ahead for Real Estate Investors.

If you locked in a 30-year fixed mortgage rate on a $600,000 house at 2.6% interest rate in 2021 you have the same monthly mortgage payment as someone that just bought a $380,000 home at today’s 6.5% mortgage rate.

That’s ~37% reduction in home value based on monthly mortgage payment affordability, but that’s not the only problem lurking in the real estate market…

Bonds are back baby! 

US Treasury rates are now trading at 3.97% (6-month), 4.27% (2-year), and 3.83% (10-year).

US Treasury’s now generate nearly that same yield as buying and renting out a house in America (aka the cap rate).

Would you rather tie up capital in a home, take on the costs of ownership and deal with some asshole tenant you’re renting it out to… OR simply buy US Treasuries for the same return?

Exactly.  

This is going to translate to a massive real estate selloff, especially among the big wall street firms (like Blackstone) who have been buying up single family homes hand over fist. 

In markets like Dallas, Austin, Denver, Salt Lake City, Seattle, and Los Angeles US Treasury rates are already higher than average cap rates. 

Meaning there is very little incentive for investors to be invested in these markets. Especially if prices are going down.

Before 2010 institutional landlords essentially didn’t exist in the single-family-rental market. Now there are more than 30 multi-billion dollar institutional investment funds, such as Blackstone, focused on buying single family housing.

Next will be margin calls as banks order investors to sell off properties to deleverage their portfolio. 

Many wall street real estate investors have funded their strategy using floating rate credit facilities. So every time the Fed hikes rates, their cost of capital on their EXISTING portfolio gets more expensive.

Think of the crisis in adjustable rate mortgages from 2008, but this time instead of individual borrowers getting hit with higher rates and defaulting, it’s now big landlords who own thousands of units. Sometimes all in one city or neighborhood.

The “experiment” of Wall Street buying single-family homes was never meant to last. Wall Street piled in, earned their fees, and are now looking to exit as quickly (and quietly) as possible before the crash gets bad.

Thinking about buying a new home? Maybe give it a few minutes… 

Real Assets.

As the financialized world sits precariously on the edge of ruin, we must remember where there is value: commodities.

If you are a Ri Member, you understand the commodity trade, but sometimes it’s hard to remember why we are commodity investors when our portfolio is getting whacked.

This is a volatile game that isn’t for everybody, but for those willing to weather the storm and play the game to the final whistle, there can (and should!)  be big rewards. 

Right now the world is in a transitional period – realizing that the past 10-years of making big returns by investing in high growth overpriced tech names has come to an end. 

We’re now in a world in turmoil, short on commodity supply, and on the edge of a recession. As hard as it is to stomach, this is what a financial regime change looks like – hard times and volatile markets. 

We must not forget that on the other side of this trade there will eventually be institutional capital flows into commodities that will drive commodity valuations (multiples) higher.

This move will happen faster than anyone anticipates, leaving investors little time to reposition their portfolios, which is why it is essential to allocate capital while there is blood in the streets and deals are cheap.

Jamie Keech

Jamie Keech

CIO; Editor

Nick D'Onofrio

Nick D'Onofrio

Head of Research

Facebook
Twitter
LinkedIn

Friendly Fire

Friendly Fire

Have you ever wondered why we no longer invade middle eastern countries?

I’ll give you a hint. It has nothing to do with Trump, Obama, or Biden spontaneously growing a conscience. 

It has nothing to do with a love for the troops. 

There  is one simple reason: ENERGY SECURITY

We don’t invade middle eastern countries because we don’t have to. The US shale revolution accomplished what pouring trillions of dollars and thousands of life into desert countries never could. It turned the USA into a net exporter of energy from a net importer. 

The ability to economically recover shale gas is perhaps one of greatest technological achievements of this generation and, although few know it, initiated the biggest shift in geopolitics of the last 30-years. Allowing US isolationism to thrive and giving Presidents the ability to turn the other cheek when their line in the sand is crossed. 

Because here is the reality: If your country does not have energy security it’s not really your country… You’re merely renting it from someone else. 

Just ask our friends in the EU…

Despite ample warnings from Trump and others they’ve managed to snatch defeat from the jaws of victory and leave an entire continent exposed to the imperial ambitions of a lunatic despot. 

But Jamie, that’s not fair you say? Europe can’t contend with North America’s vast geological resources. Just the luck of the draw!

Wrong!

Even though they don’t want you to know it, there is vast shale potential in Europe too. According to a 2011 study, Europe has 18 trillion cubic meters (tcm) of natural gas.

Europe has a long history of oil and gas production dating back to the mid 19th century, just like the US. The Polish Bobrka field was discovered in 1853, gas in Britain’s Weald Basin was discovered in 1875, and deep gas was discovered in Italy’s Po Valley in 1945. 

There is oil and gas in Europe.

But to put this fact into context first we must explore how shale revolutionized O&G estimates for US recoverable reserves. 

In the image below you’ll notice two things:

  1. Shale extraction exploded the US’s recoverable natural gas reserves
  2. When exploration starts reserves consistently increase (i.e. there is no short term lack of supply, only investment)

This next chart demonstrates more of the same. Basically if you invest in exploration and production (E&P) you tend to  find new reserves (shocker!).

Now, let’s look at a few European countries with shale potential – which have all been thwarted by bad policy. 

Below is a map showing several of the shale gas basins in Europe. It should also be noted that historically when large scale exploration programs have been launched they have found more hydrocarbons than expected.

European Shale Basins

Some of the most prospective shale gas fields are:

Poland: Estimated reserves of 5.3 tcm of shale gas with +1bcf/d of production possible by 2025 (~3% of the EU’s current gas demand) if development started today. 

But, because of a lack of support from the EU and local governments there has not been any natural gas production to date

UK: There are shale plays in the East and South along with remaining conventional reserves in the North Sea. There are estimates of more than 25 tcf of recoverable natural gas in Britain.

No commercial gas has been produced to date – British regulations stopped shale gas exploration in its tracks via a 2019 moratorium. Today, the tide is turning. Just a few days ago, new British Prime Minister Liz Truss removed the ban on fracking.

France: The infamous Paris Basin (discovered in 1923) has produced significant oil – 800 wells have been drilled producing more than 240 million barrels of oil. The Paris Basin is estimated to have more than 5.6 tcf of natural gas resource and 558 million barrels of oil. 

In 2017, led by French President Macron, parliament passed laws to become the first country in the world banning any new oil exploration licenses with immediate effect and all oil and gas extraction by 2040. 

Even in the midst of an energy crisis, the French are sticking by their green policies. 

The takeaway: the EU has hydrocarbon resources.

Energy independence?

There is a case to be made that within 3 years the EU could be approaching energy independence if they simply opened up the market to meaningful exploration; not just shale but offshore as well. 

In the US, we saw ~30% natural gas production growth in 2 years from 2017 to 2019. 

With the EU’s current high gas prices, the tailwind behind E&P growth could be much greater than what we saw in the US. 

We haven’t even talked about the Dutch Groningen gas field yet – one of the 10 largest gas fields globally. Just 5 years ago the field was producing 30bcm annually. Since then, the Dutch government has reduced production to sub 5bcm annually, but believes production could easily be ramped up to 25-30bcm (16% of Russian imports). 

Why did they reduce production? Because regulators believe that natural gas production out of certain regions of the Groningen gas field carry significant earthquake risk. 

Europe’s reliance on Russian gas is not geological destiny, but rather choice. A choice that continues to look increasingly dire as we approach winter. 

What do you think politicians’ appetite for O&G production will be after a winter of sleeping in their mittens?

Jamie Keech

Jamie Keech

CIO; Editor

Nick D'Onofrio

Nick D'Onofrio

Head of Research

Facebook
Twitter
LinkedIn

Which do you want to be?

Democrats passed the Inflation Reduction Act and it magically made inflation vanish, even before the bill was signed into law. This is how good the bill is, it retroactively reduced inflation.

No, this is not Biden having a brain fart. This is the official messaging of the current administration. 

Now, this isn’t exactly a lie – the official inflation number increased 0% from June to July (month over month), but it did increased by 8.5% year over year.

The Market Responds

Inflation fell from 9.1% in June to 8.5% in July, and the market believes that the Fed is getting closer to hitting a homerun (AKA gradually cooling inflation without a recession). This bodes well for stocks and the USD, and the market is reacting accordingly. 

As we mentioned a few weeks ago, the US looks like a much more attractive home for capital at the moment than the rest of the world. For this reason, we’ve been predicting this rally in equity markets… But I wouldn’t get your hopes up as we don’t expect it to be long lived.

Industrial output peaked in 2Q 2022. What many investors got wrong was the assumption that following this peak would be an immediate recession. Before we see a recession, manufacturing jobs have to start contracting. In July, manufacturing jobs increased by 30,000. 

The 30,000 jobs created are half of what that number was in April, which establishes a slowdown, but not a contraction. 

Manufacturing jobs are a lagging indicator, but tend to be led by the ISM Manufacturing Employment Index by about 3 months. This is also yet to decline in a manner that would indicate we are in a recession.

ISM Manufacturing Employment Index

So, over the past 2 weeks the market has apparently decided that we’re not in a recession, the economy is strong, and inflation is declining… 

All this misses a few key points.

If inflation stays at 0% month over month for the remainder of the year, December’s inflation number will still land at 6.3% year over year. Which is still 3x higher than the Fed’s target of 2%. 

Meaning, the Fed isn’t going to pivot – they’ll likely be hiking rates into 2023.

Here are the major events leading up the September Fed meeting and the importance of each event:

  • Fed’s Jackson Hole Economic Symposium: end August (updated Fed guidance)
  • Monthly Jobs Report: Sept. 2 (indicator of economic growth)
  • September Inflation: Sept. 13 (will determine magnitude of rate hikes)
  • Fed Interest Rate Decision: Sept. 21 

The road to this imagined September pivot on rate hikes will be paved with pain as investors come to realize that the economy is neither in a growth or recessionary phase. We are in the midst of STAGFLATION – stagnant economic growth paired with high inflation.

Let me be as clear as possible. 

Inflation will not resolve itself, the Fed will have to slow the economy to contain inflation. The market will likely come to this realization when 2023 corporate earnings expectations are slashed.

Meaning, eventually the economy will roll over into a recession and only then will the Fed pivot on interest rate policy.

Tech jobs are getting slashed left and right. Many of my tech friends are telling me their companies are in the midst of laying off 30% of their workforce.

Housing is beginning to cool off as well – new homes for sale are handily outpacing new homes sold. In the last 50 years, this has always led to a recession, and usually an ugly one, as housing stats and GDP tend to be very closely correlated.

New Homes for Sale (Orange) vs. New Homes Sold (White)

The size of the gap between Housing Sales and Houses For Sale suggests a recession like 1974, which was pretty damn ugly. 

Which are you going to be?

The world has yet to come to terms with the fact that we are not going back to an environment supported by low inflation, globalization, and cheap energy. 

Out of control government spending continues to tip the debt/GDP scale in the wrong direction, which is wildly bullish for precious metals.

Meanwhile, destructive environmental and energy policies continue to drive capital out of the commodity sector and reduce supply. This has been the first commodity upcycle to end without any significant capex being spent.

Think about that, prices of commodities went up, and almost no money was spent increasing supply… thus offering no price relief.

Once we get through this bumpy patch, what is it going to take to actually bring more supply online? Commodities such as copper, oil, gas, uranium, lithium, etc will NEED to be much much more expensive. 

Jamie Keech

Jamie Keech

CIO; Editor

Nick D'Onofrio

Nick D'Onofrio

Head of Research

Facebook
Twitter
LinkedIn

Rates & the Market

Rates & the Market

Recently we discussed how, as the Fed raises rates, we expect the dollar to continue its move higher, and a subsequent rally in broader equity markets. 

We are currently seeing this trade in full swing as the Fed raised the fed funds rate last week by 0.75% to 2.25% and the S&P 500 is trading at about 4,125 (up from 3,700 a few weeks ago!). Stocks are still following the playbook from the past decade, acting as though the Fed will soon ease interest rate policy. 

This rally will be short lived. 

Things are different in a post pandemic world – inflation, not deflation, is now public enemy number 1. Under the current economic conditions, the Fed will likely continue hiking rates into the fall  until inflation is under control. 

The only way inflation is going to slow is through a true recession, the kind where we see mass layoffs and real economic hardship. Only then will the Fed finally start slowing hikes or cutting rates.

This recession is coming faster than most believe.

It’s going to be painful BUT it will kick off the next bull market in precious metals. In the meantime, it is important to understand why markets are behaving the way they are.

The chart above compares the S&P 500 today (black) with the S&P 500 during the 2000 tech bubble (blue) and the 2008 housing bubble (green).

As you can see… It’s not looking good for our generalist friends.

Gas & Fertilizers

The green revolution tribe is quickly turning into a death cult. The hardcore greenies are pushing forward policies that are going to have very scary impacts on access to food and energy.

Prime Minister Justin Trudeau is pursuing the same climate policy that sparked mass protests in Europe.

The Trudeau government introduced a plan to reduce nitrogen emissions from fertilizer use similar to the Netherlands policy that sparked protests among thousands of farmers.

The plan to achieve emission targets set by the Canadian Federal government calls for reduction in fertilizer production by 30%.

Now… I’m no farmer, but I have been blessed by a bit of common sense, and it’s telling me:

Less fertilizer = Less food

Let’s take a look at our friends in Sri Lanka who decided to ban organic fertilizers which cut crop yields in half.

Turns out hungry citizens don’t make the best constituents… Conversely they do appear to have more energy to occupy Presidential Palaces.

While we’re on the topic of fertilizers…

Last Wednesday, Germany’s BASF (the world’s largest chemical company) cut ammonia production even further to preserve natural gas for electricity use. Germany’s first and fourth largest ammonia producers, SKW Piesteritz and Ineos also said they could not rule out production cuts as the country grapples with disruption to Russian gas supplies.

It’s looking like a long, cold and now hungry winter for Europe. 

Famines & Fertilizers.

Farmers rely on three key nutrients for fertilizer: nitrogen, phosphorus, and potassium. A combination of these elements is used to fertilize crops and maximize harvests. Natural gas, after being converted to ammonia, is the main feedstock for nitrogen based fertilizer.

Most of the world’s ammonia is used for making nitrogen fertilizers. 

Fertilizer shortages not only mean that prices have been rising, but many farmers are not even able to buy as much fertilizer as they need. This has led to farmers all over the world struggling to figure out how to keep crop yields up with as little fertilizer as possible.

This might sound like a distant problem, but less fertilizer is going to lead to food shortages. The world’s biggest soybean producer estimates that a 20% cut in potash (potassium) would result in a 14% drop in yields. The International Fertilizer Development Center is predicting that this year’s rice and corn harvest in West Africa will shrink by 30%.

Food shortages make food more expensive. Even in the best-case scenario, experts are calling for lower crop yields and higher grocery store prices across the board on everything from milk to beef to packaged foods. This could last for months or even years.

Food inflation causes people to eat more processed/unhealthy food and poor diet leads to a litany of health consequences.

Energy supply is life.

The takeaways.

There are a few important points to note:

  • We have not fully experienced the effects of the Russian invasion – markets are trying to price in expectations, but we haven’t seen supply/demand shortfalls fully play out yet.
  • The energy and fertilizer shortage is going to sustain inflationary pressures. 
  • The same inflationary pressures are likely to stir more and more civil unrest around the world. 

This wild ride is just getting started. Stay vigilant and diligent, there will be opportunities to make a few fortunes over the coming years for those paying attention.

Jamie Keech

Jamie Keech

CIO; Editor

Nick D'Onofrio

Nick D'Onofrio

Head of Research

Facebook
Twitter
LinkedIn

The USD

Last week we saw another MASSIVE inflation print as headline CPI reached a four-decade high: 9.1%

This puts the Fed and markets in an interesting position. As inflation has yet to peak there remains pressure to raise rates even faster to slow the economy, meanwhile GDP is likely contracting for the second straight quarter. This means the Fed is in the unusual position of trying to slow the economy while GDP is contracting. 

This comes as no surprise to Ri Members, as we’ve been hammering on this theme for months. We also know these conditions are setting up a trade in precious metals. 

However, precious metals miners have been under significant selling pressure all year. This downward pressure is unlikely to let up before the fall, when I expect silver and gold to enter their next bull run. 

Let’s dig into why. 

The USD &  Rates

Fact: precious metals perform well when the dollar is weakened. 

Today this is largely tied to the fed funds rate. As the fed funds rate increases, overall interest rates such as treasury and credit rates rise. Higher rates typically result in a stronger economy and better returns. As global capital flows into US dollar-denominated assets, chasing higher returns, the dollar strengthens.

The important takeaway here is that the dollar won’t weaken until the Fed is forced to capitulate on their current stance by cutting interest rates. 

The question is when will that happen?

The Fed will only capitulate when a recession is imminent.

Globally many central banks have been far slower than the Fed to raise rates, especially the European Central Bank (ECB) and Bank of Japan (BoJ). Because of this, we are seeing capital flee those regions and pour into US equities and bonds. 

This has resulted in the USD surging higher. We’re seeing the Euro and USD hit parity for the first time.

This is good for US consumers, but bad news for exporters – AKA bad for GDP growth.

High inflation is catalyzing a narrative that the Fed is doing the right thing by raising rates to preserve US equity markets and dampen wage growth. This narrative could very likely only last a few months while the Fed maintains hope that a US recession isn’t a done deal…

BUT, the rest of the world appears to be sticking to loose monetary policy, and keeping interest rates low. The ECB and BoJ’s decision to promote loose monetary policy is furthering dollar strength, whilst their own economies struggle due to high oil/coal/natgas prices impacting growth. 

REMEMBER: Energy commodities are priced in USD, meaning price increases are even greater in weak foreign countries. 

For example:

  • Last summer EUR€1.00 was worth USD$0.85. 
  • Today EUR€1.00 is worth USD$1.00. 
  • Last summer  Brent Oil was trading at USD$70/bbl, or EUR€59.50/bbl. 
  • This summer Brent Oil is trading at USD$100/bbl, which is EUR€100/bbl. 

While that’s a 43% increase in USD terms, it’s a 68% increase in EUR terms.

What does this mean for markets?

Since mid June we have seen US equity markets trading higher. Perhaps this summer we’ll continue to see a rally in US equities while USD strength persists and foreign assets plunge.

Eventually (we think this fall) stocks will finally get the message that 2023 earnings are going to SUCK. Then it’s risk off in the US this autumn and the party is over.

When the Fed realizes that the earnings outlook is bleak and a recession is imminent, only then will they start softening policy (AKA slowing hikes or cutting rates). 

What will happen next (our thesis) ?

  • The dollar will start to fall;
  • US equity markets will sell off hard;
  • Precious metals will catch a bid in a big way; and 
  • Energy Prices are going to soar with a weakening USD as a tailwind.


This has been a brutal few months for basically every other asset class out there. I know from talking to several Ri Members over the past month that most of you are feeling it across your portfolio. 

But, buckle up friends. This ride is only getting started.

We all knew a major secular sell off was coming. We all knew tech had to get crushed. We knew the S&P was massively overvalued compared to real assets. We knew interest rates could not stay at all time lows FOREVER and had to rise. 

We’ve been talking about it and positioning for months years. 

Now the rebalancing is happening. 

There’s a crisis, blood in the streets, and panic. 

And investors are doing what they always do in a panic – going to cash. Selling anything they can at any price. Stuffing the USD under the proverbial mattress. 

And when the dust settles…

When companies start getting valued on cash flow as opposed to hype… 

When earnings get crushed… 

When the dollar begins to slide…

And, the reality of this brave new world sets in…

Where do you think that money goes??

  1. Gold;
  2. Energy; and
  3. Basically every other essential commodity. 

 So… when you lie awake at night and think about your  beaten down portfolio, fear not, you’re in the right place.

And when your friends at the country club tell you they’re buying the dip and loading up on Facebook… Maybe forward them this post and help them do a little damage control before it’s too late!

Jamie Keech

Jamie Keech

CIO; Editor

Nick D'Onofrio

Nick D'Onofrio

Head of Research

Facebook
Twitter
LinkedIn